FARTCOIN price drew attention on Tuesday, August 18, 2026, after the token rebounded from a key support area. Analysts noted renewed momentum on the daily chart. Traders now await confirmation of a potential price breakout.
As of press time, FARTCOIN is trading at $0.1434, marking an increase of 0.52% in the past day. The 24-hour trading volume is currently standing at $8.82 million, with a market capitalization of $143.45 million. Over the last week, the FARTCOIN price has gone up by 5.1%, according to CoinMarketCap.

Also Read: BNB Price Eyes $618 as Open Interest Nears $1 Billion
FARTCOIN Price Holds Support as Bulls Target $0.20
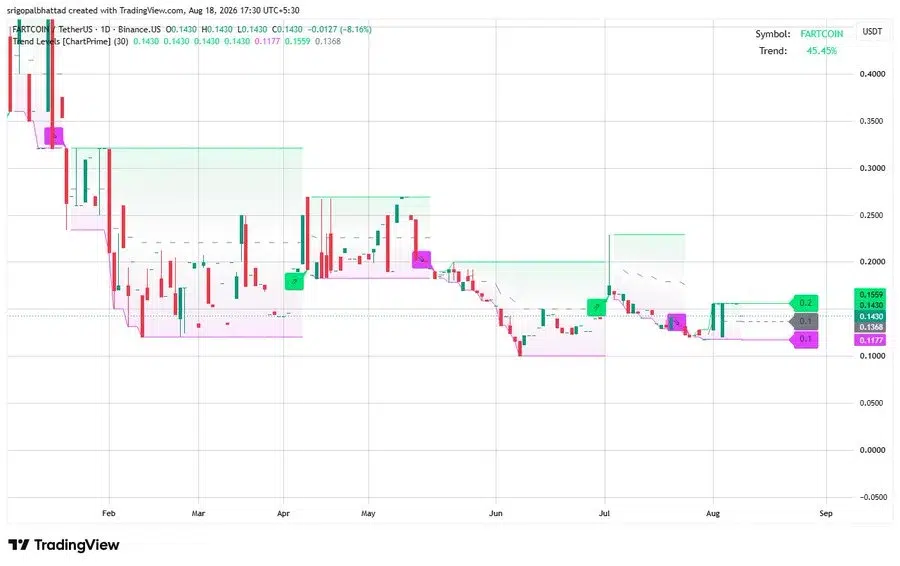
Popular analyst Crypto With Gopal pointed out that the FARTCOIN price demonstrated a bullish setup on the daily chart. The token bounced off the support at $0.118 and managed to reclaim $0.143.
The analyst mentioned that the price range from $0.136 to $0.141 is the primary support area. Holding this range would keep the bullish structure intact. A drop below the area would weaken the setup.
The analyst marked the resistance level at $0.156. The confirmation of a breakout can pave the way for $0.20. For now, the token is trading below that breakout level.
What Happens if FARTCOIN Breaks Above $0.1450?
Moreover, another analyst, Crypto TXG, mentioned that FARTCOIN avoided a deeper decline toward the $0.0936 support level. Instead, the token found support near $0.12 and started to recover. The rebound then strengthened its short-term position.
Following the recovery, FARTCOIN advanced toward the $0.1450 resistance level. Buyers began testing the barrier as momentum improved. However, the token had not confirmed a breakout above it.
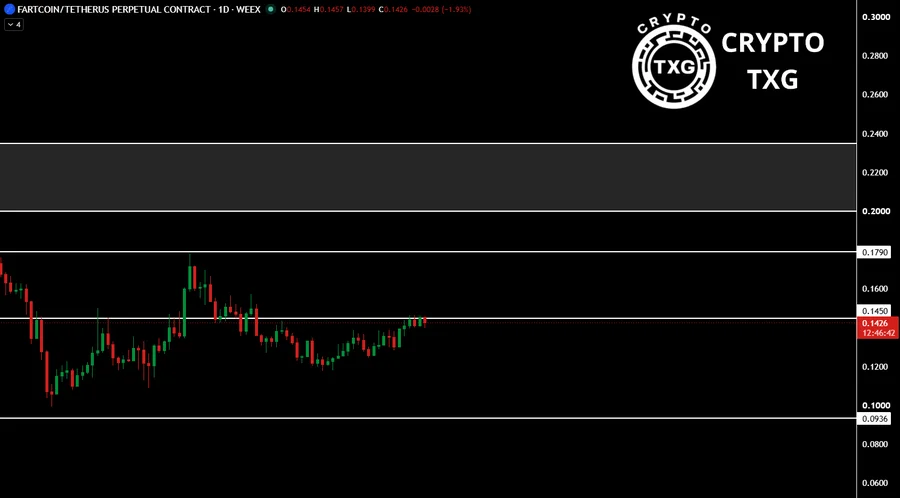
According to TXG, a successful move beyond $0.1450 could send FARTCOIN toward $0.1790. A rejection would prevent the expected advance. It could also keep the token trading within a choppy range.
How EMA and Bollinger Bands Shape FARTCOIN’s Outlook
According to TradingView, the FARTCOIN price is above the short-term Exponential Moving Average (EMA) on the daily chart. The 20-day EMA stands at $0.13635, and the 50-day EMA is slightly higher at $0.13751.
However, the token is below the long-term moving average lines. The 100-day EMA is priced at $0.14999, while the 200-day EMA is much higher at $0.20262.

The Bollinger Band (BB) data showed a middle band at $0.13353, the upper band at $0.14701, and the lower band at $0.12004. The FARTCOIN token trades above the middle band at $0.1434 but remains below the upper boundary.
Also Read: Polymarket Blocked in South Korea Over Gambling Concerns
This article contains market analysis and price predictions. These are not guarantees. Crypto markets are volatile. Always DYOR. Not financial advice.