The price outlook for HYPE has gained significant attention in March 2026 as investors assess whether the token can extend its recovery following recent volatility.
The token is the native asset of the Hyperliquid decentralized trading environment and has gone through strong price swings since reaching its all-time high in 2025. Market analysts are now closely monitoring technical levels and network growth indicators to estimate how high the token could rise during the current month.
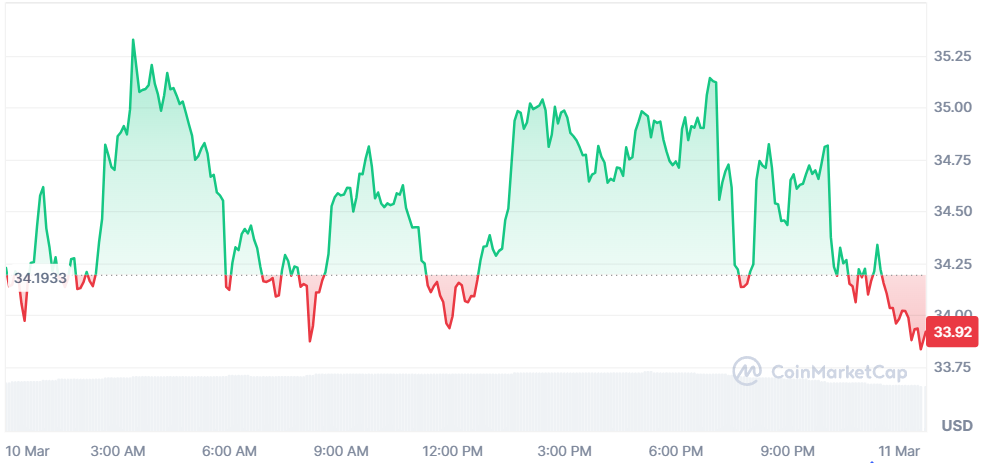
According to the data given by CoinMarketCap, at the time of writing, the coin is trading around $33.92 with a 1% increase in rate. The daily trading volume of the token is around $420.09 million, and the market cap of the coin has exceeded $8.75 billion.
Also Read: Hyperliquid (HYPE) Breaks Key Resistance and Signals Bullish Move to $39
HYPE’s Recent Price Performance
The token’s price chart reveals an upward momentum, and it could climb toward the resistance (yellow) at around $34.89. Assuming the bullish pressure strengthens, the golden cross might emerge and send the price up to test the $36 range.
If a reversal occurs, the bears might push down the asset’s price to the support (blue) at $33.85. In case the downside correction gains more traction, the death cross could form, and likely drive the asset’s price to a low of $32 or even lower.

The moving average convergence divergence (MACD) indicator reflects the coin experiencing a bullish momentum as the MACD line (blue) is above the signal line (orange). The relative strength index (RSI) indicates the token is being overbought as the RSI line is well above the 50 median.

According to CoinCodex, the cryptocurrency might have an average price of $ 26.99 and a maximum price of $ 33.96 in March. The potential ROI of the coin is month might be 0.25%.

According to the data given by CoinCodex, the 200-day simple moving average in the long run is projected to reach $ 34.42. The 50-day simple moving average (SMA) in the short term is projected to reach $ 29.85. All these figures reflect a gradual but certain movement towards the higher ground.
Also Read: Hyperliquid Buybacks Remove 11,768 HYPE From Circulating Supply