Injective (INJ) has broken above key resistance, shifting into a potential uptrend. Technical indicators like a bullish MACD crossover and strengthening moving averages support rising momentum for the INJ price, while declining open interest and volume reflect reduced participation and cautious sentiment despite the improving price structure. According to CoinMarketCap, INJ is trading at $5.16 with a daily loss of 3.52%.
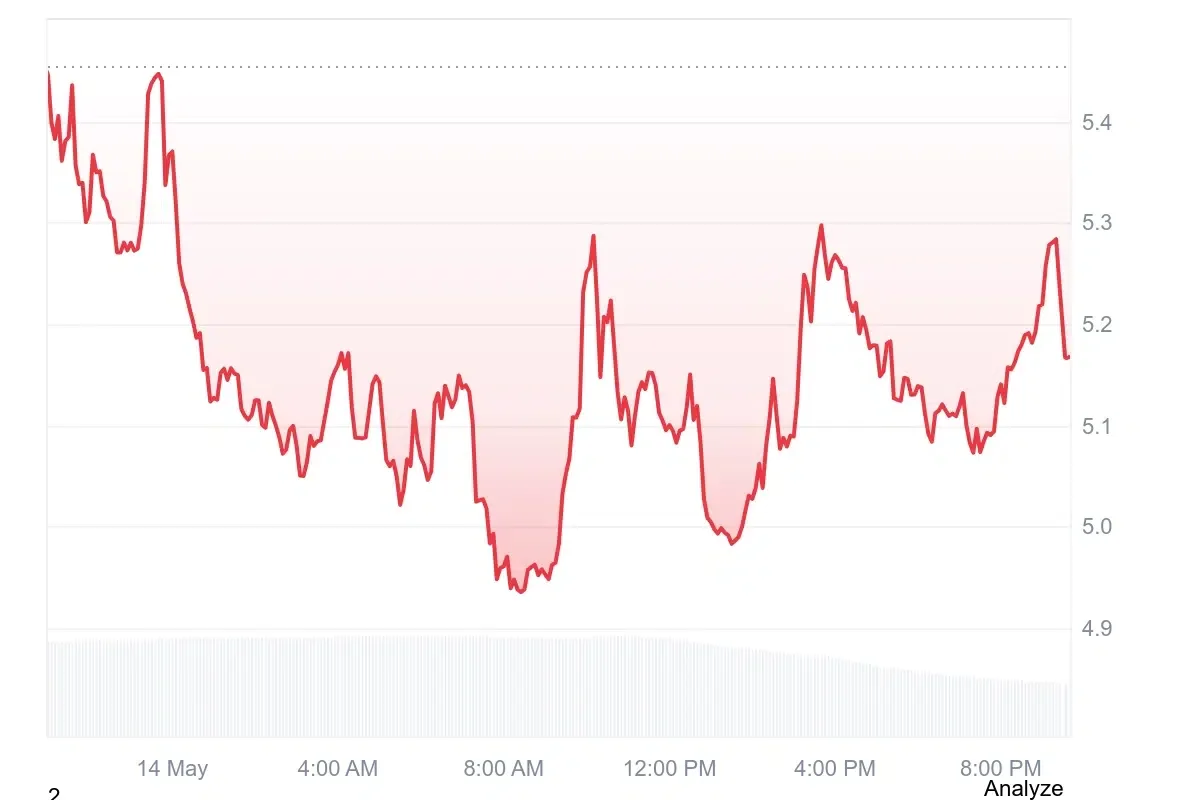
Source: CoinMarketCap
INJ Derivative Data Point to Declining Strength
According to Coinglass, the INJ open interest declined by 10.96%, reaching $114.18 million, indicating fewer active derivative contracts held by traders. This suggests reduced market participation, lower speculative positioning, and a possible shift toward caution or profit-taking.
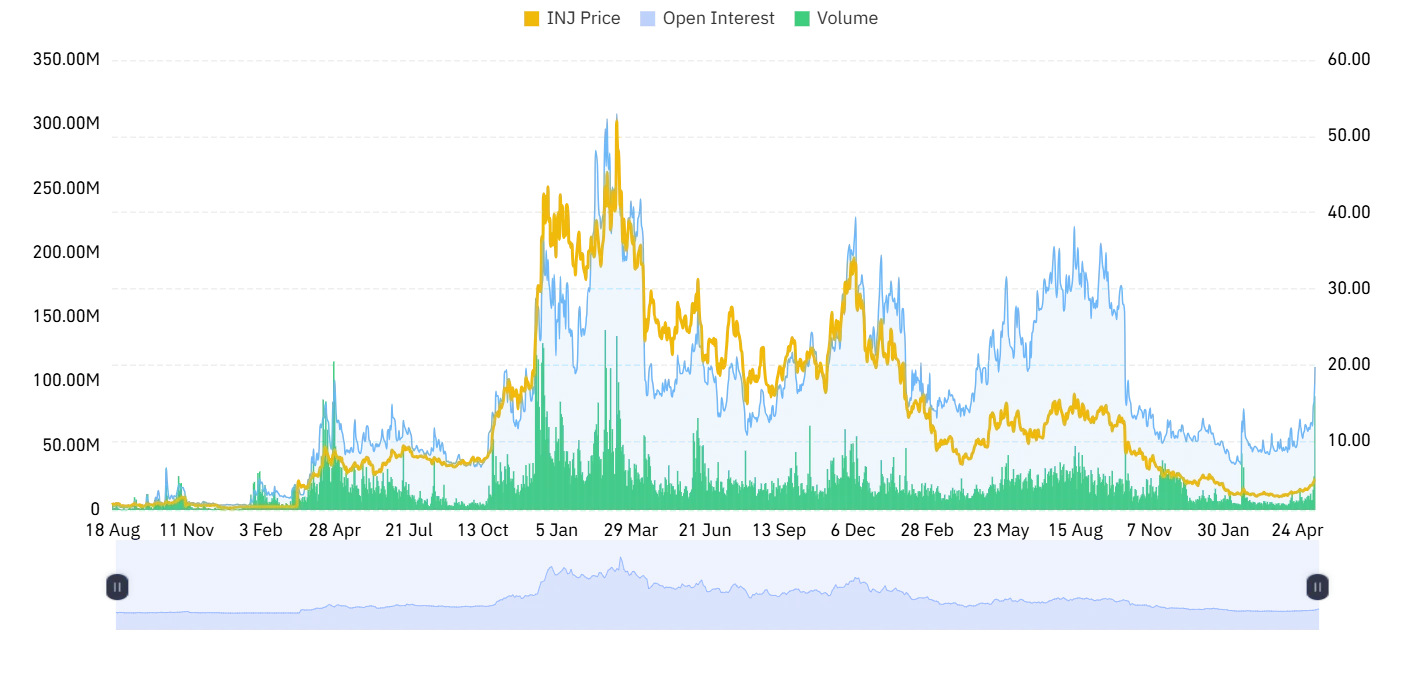
Source: Coinglass
Trading volume decreased by 28.88%, falling to $748.79 million, reflecting reduced market activity and weaker participation among traders. This decline suggests lower liquidity, diminished momentum, and less aggressive trading behavior compared to prior periods.
Also Read: Injective Price Rises as USDC and CCTP Go Live on Injective Network
INJ Price Eyes $51 Rally as MACD Turns Bullish Again
Furthermore, the crypto analyst Javon Marks highlighted that the INJ gains attention as it forms a positive MACD crossover on the higher timeframe chart.
This technical trigger usually denotes a change in the atmosphere, where there’s a decline in selling activity, allowing buyers to start taking control again. For traders, this is often seen as an early indicator of an impending change in trend direction for the INJ price.
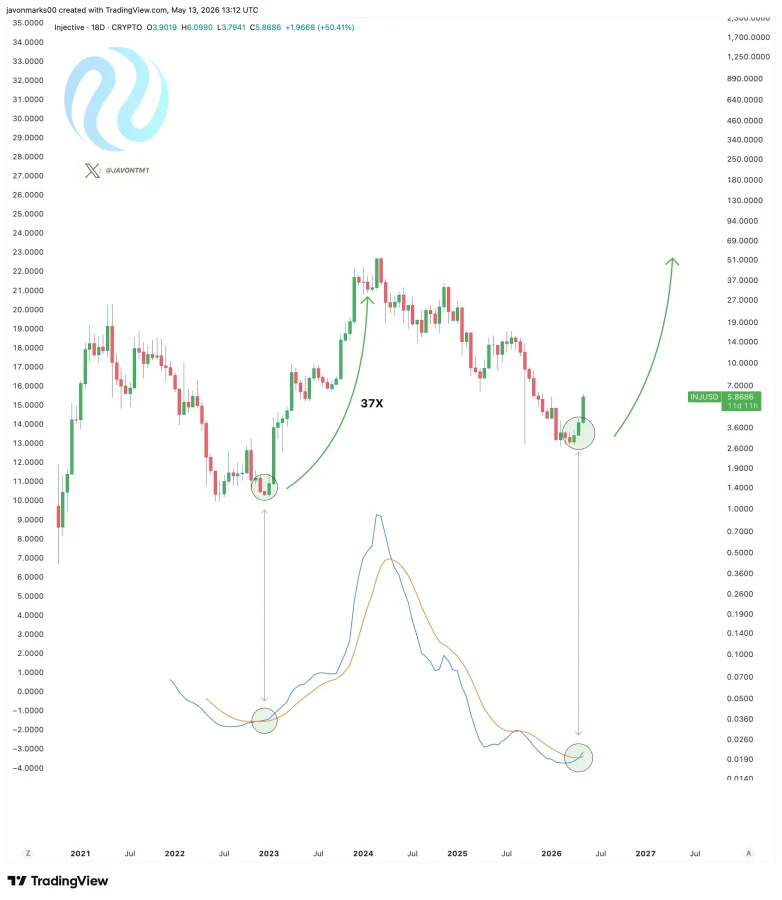
Source: Javon Marks’ X Post
A crossover like MACD in Injective historically suggested an explosive move of more than 3,600%, driving the price to the $51 mark. Although no guarantees exist, such a similarity is prompting speculation regarding another positive surge for the INJ price.
Even though experts warn that any proof should come from trading volumes and movements in price, momentum traders keep a close watch.
Technical Indicators Point to Strong Upward Momentum
According to TradingView, INJ price is exhibiting a strong breakout pattern on the upside. The price had formed a base near the $2.80 level in the month of March, which then rallied up steadily before breaching the 200-day EMA level at $5.08. It is currently trading near the $5.24 area after making a trend reversal.
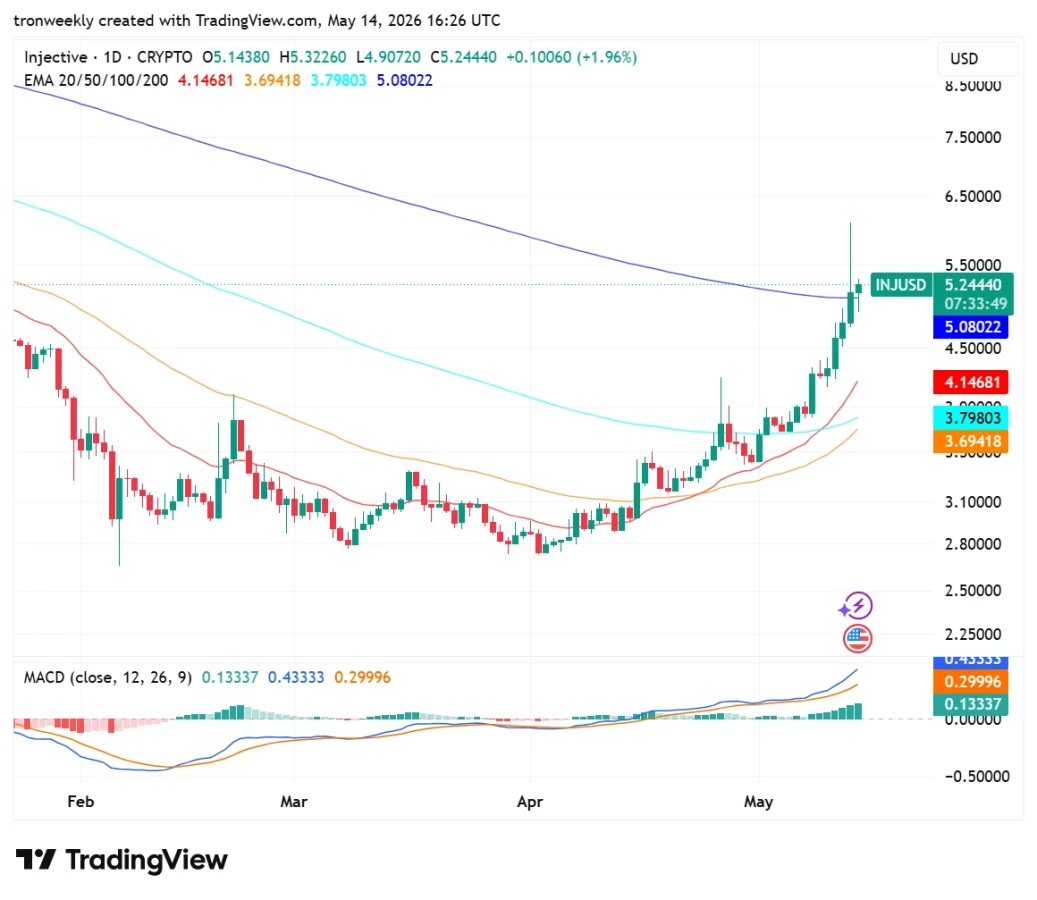
Source: TradingView
The technical indicators continue to provide strength to the bullish trend. The MACD indicator forms large bars in green colors while the MACD blue line is clearly crossing above the orange signal line.
On the other hand, the shorter-term EMAs remain dispersed below the price action in an effort to support a further price rise.
This article contains market analysis and price predictions. These are not guarantees. Crypto markets are volatile. Always DYOR. Not financial advice.
Also Read: Injective Price Prediction: INJ Bullish Breakout Targets $5.50 Resistance