Injective (INJ) price shows a strong bullish recovery after a prolonged downtrend, forming a clear Elliott Wave structure. Momentum is cooling near key resistance, while RSI and MACD indicate consolidation. Despite short-term weakness, institutional adoption through a regulated fund supports long-term growth and strengthens overall market confidence.
INJ Price Strong Recovery After Downtrend Phase
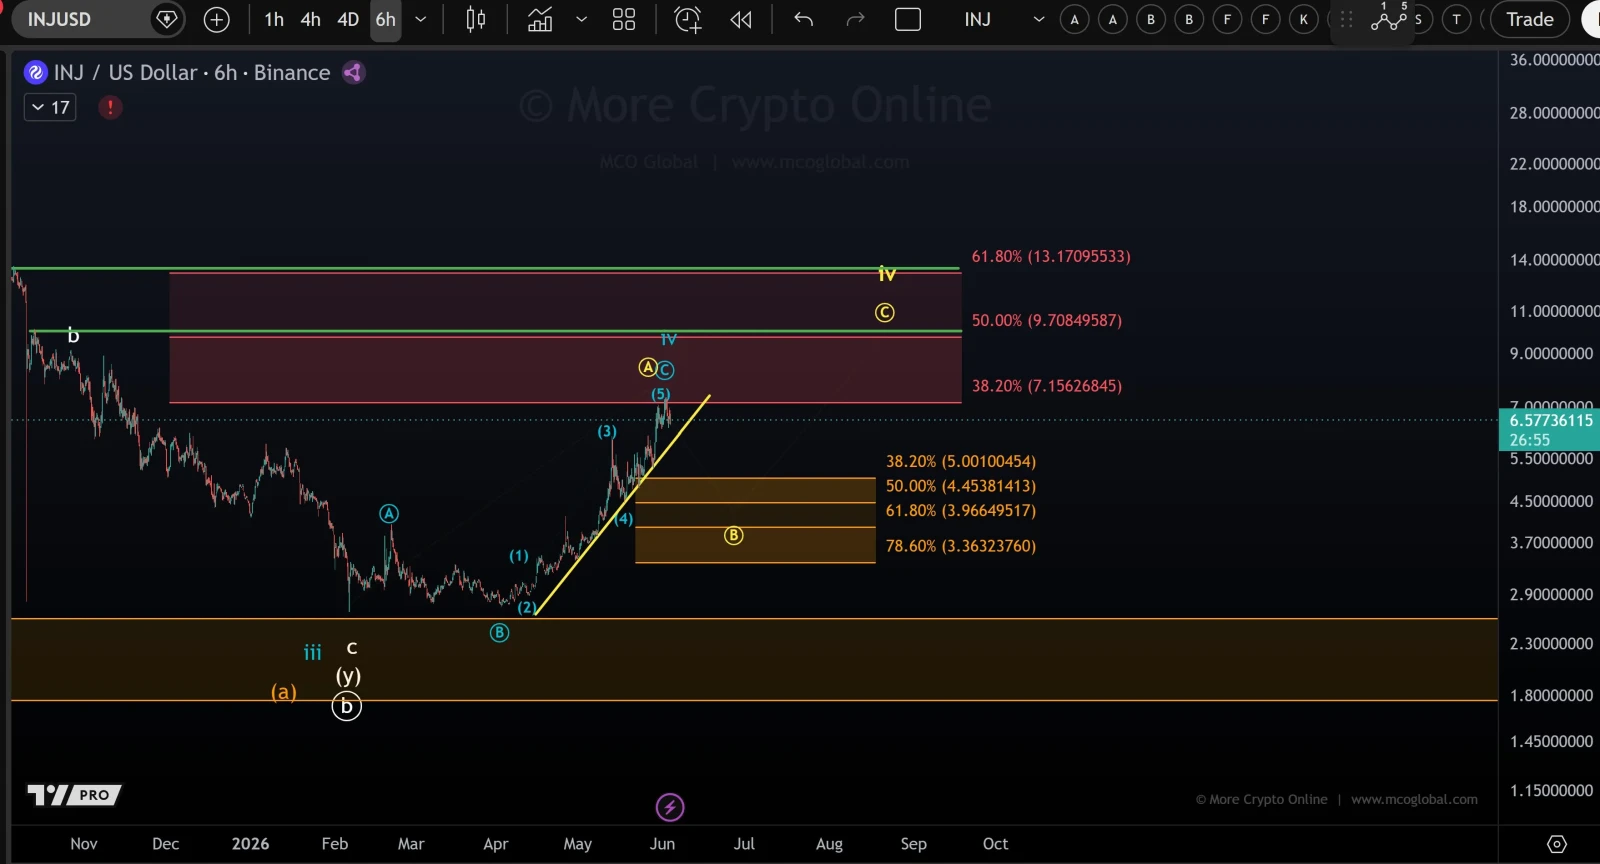
The Injective (INJ) price chart shows a strong bullish recovery after a prolonged downtrend, forming a clear Elliott Wave impulse structure.
Price rallied from the $2.3 base into a 5-wave advance, now trading near $5.75, suggesting momentum is cooling as it approaches major resistance around $7.15.
According to the crypto analyst MCO Global DE, Key Fibonacci resistance levels are placed at $7.15 (38.2%), $9.70 (50%), and $13.17 (61.8%), indicating potential upside targets if bullish strength continues.
However, these zones also act as heavy supply areas where profit-taking may trigger volatility or rejection in short-term price action.
On the downside, retracement support lies between $5.00 and $4.45, with deeper protection at $3.96 and $3.36.
The setup remains bullishly intact as long as prices are above the rising trendline. However, a small dip probably will happen before another big jump up.
Also Read: INJ Price Prediction: Bullish Momentum Signals an Explosive Move to $60
Mixed Momentum Suggests Possible Breakout Ahead
Right now, RSI is at 53.98, and the moving average is 68.22. This signals that the bull run is cooling off after being overbought, according to the TradingView chart.
Prices indicate a consolidation phase too. Buyers are around, but their upswings are getting weaker as prices hit the resistance zone.

The MACD suggests we’re still in bullish territory. The histogram is close to balanced, with the MACD line at 0.55310, not far from the signal line at 0.55340.
The histogram shows -0.00030. So the trend is up, though it’s slowing down. This could mean a brief pause, followed by another push in one direction or the other soon.
Regulated INJ Fund Launches Across Asia
Despite the price action, Merkle Capital launched M-INJ, Asia’s first regulated INJ fund, built on Injective. This gives local investors a legit way to get into INJ.
Plus, it lets them ride the INJ wave within a regulated structure. INJ is now available through mainstream institutions, marking a big step for Injective in traditional finance.
The regulated fund opens doors for pro investors, bumping up liquidity, credibility, and ongoing involvement in Injective’s booming global network.
This article contains market analysis and price predictions. These are not guarantees. Crypto markets are volatile. Always DYOR. Not financial advice.
Also Read: INJ Price Prediction: Can It Break Resistance and Surge Toward $22?