Pepe Coin (PEPE) experienced an increase in volume and good technical indicators on April 16, 2026, as a possible sign of a short-term breakout. The price action is being observed at an important mid-channel support for continuation or further downside pressure.
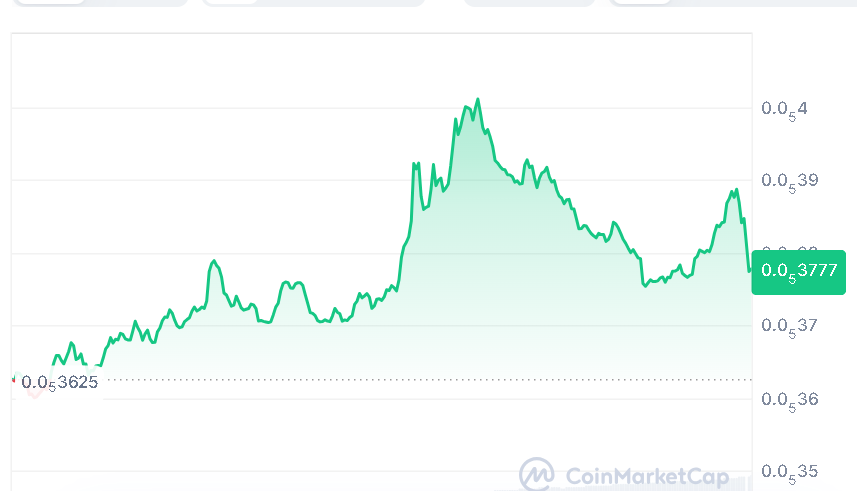
At the time of writing, PEPE is trading at $0.000003777, posting a 5% gain over the last 24 hours. Daily trading volume has reached $725.22 million, while its market capitalization stands at $1.60 billion, reflecting a notable increase in market activity and trader engagement.
Source: CoinMarketCap
Also Read | Tether joins $134 Million stablecoin raise, boosting global financial infrastructure
PEPE Gains Strength on Volume
A crypto analyst, Alpha Crypto Signal, indicated on April 16, 2026, that PEPE had begun showing strength owing to an observable increase in volume. In this regard, it should be noted that the most important support area for PEPE would be the middle area of its ascending channel.

Source: Alpha Crypto Signal’s X Post
Maintaining the support area may allow the price to go up to the top border of the channel, where it could make another breakout higher.
Should the price not be able to hold onto support at this mid-level, then the lower end of the trading channel could become relevant to mention. The investors would see better chances of getting into trades at this level from the risk-reward point of view.
PEPE Indicators Improve as Momentum Builds
Indicators are signaling positive changes, although confirmation is not strong enough. The RSI level is around 56.69, implying strength without being overbought. The signal line for RSI is close to 52.52, which indicates a steady climb, not a rapid rise.
PEPE appears to be attempting to move above its shorter-term moving averages (20 days and 50 days), which shows that there is potential for buying pressure. However, the longer-term moving averages (100 days and 200 days) remain above the price level.

Source: TradingView
MACD has started to show signs of improvement, moving close to zero and becoming positive. There is a crossing of the MACD line above the signal line, which indicates a possible shift in momentum. But this is a small change that requires more volume for confirmation.
PEPE Shows Early Recovery Signs
Overall, PEPE appears to be showing signs of an early recovery phase, and the key to its further progress is to remain above the mid-channel support level. The bullish momentum could get a boost following a successful breakout.
This article contains market analysis and price predictions. These are not guarantees. Crypto markets are volatile. Always DYOR. Not financial advice.
Also Read | WLFI Proposes 4.52 Billion Token Burn as Governance Pressure Rises