• Skip to primary navigation
  • Skip to main content
  • Skip to primary sidebar
  • Skip to footer
  • About TronWeekly
  • Write for us
  • Terms and Conditions
  • Privacy Policy
  • Disclaimer
  • Contact
  • All Posts
  • Advertise

TronWeekly

Crypto World News

  • Home
  • Latest News
  • Opinion
    • Education
    • Best TRON Wallets
    • Beginner’s guide to TRON
    • Tron Tokens
    • Market Analysis
  • Industry
    • Tron Exchange
    • Project Review
  • Press Release
  • Bitcoin (BTC)
  • Ripple (XRP)
  • Advertise
  • About TronWeekly
    • The Team
    • Editorial Policy
    • Write for us
    • Privacy Policy
    • Disclaimer
    • Terms and Conditions
    • Contact
You are here: Home / Cryptocurrency News / Pi Network (PI) Breaks Falling Wedge as Bulls Target $0.20 Resistance

Pi Network (PI) Breaks Falling Wedge as Bulls Target $0.20 Resistance

What to know:

  • Pi Network (PI) breaks a 4-hour falling wedge, signaling a potential short-term bullish reversal.
  • Key resistance levels at $0.20 and higher moving averages must be cleared for trend confirmation.
  • RSI is near oversold, and a positive MACD histogram indicates early signs of recovery, but the trend remains under pressure.

By Bena Ilyas | Edited By Ammar Raza,February 26, 2026, 9:30 PM

Pi Network

Pi Network (PI) broke out of a falling wedge formation on the 4-hourly chart, which occurred on February 26, 2026. This is a bullish signal, which may change the short-term momentum dynamics after weeks of selling pressure. However, the overall trend is still under pressure, with significant resistance levels remaining in place.

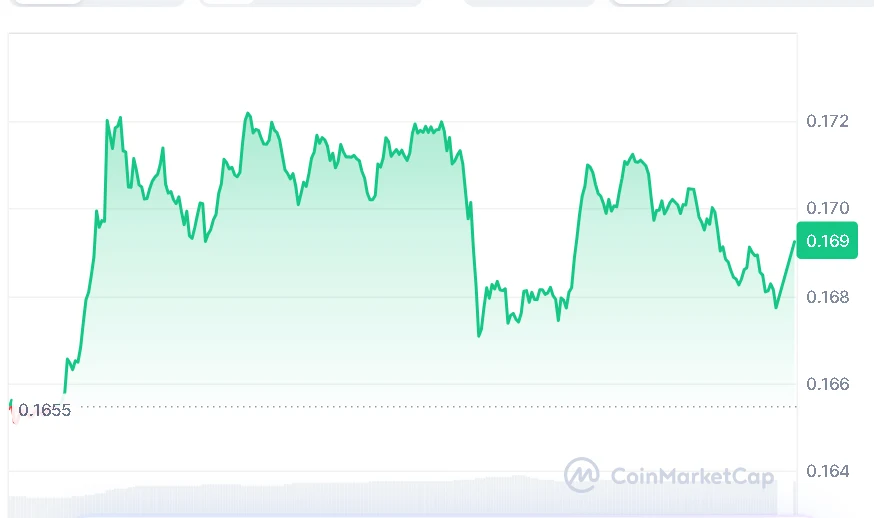
At the time of writing, PI is trading at $0.1692, posting a 2.42% gain over the last 24 hours, according to data from CoinMarketCap. The token has recorded $24.85 million in daily trading volume, with its market capitalization standing near $1.56 billion.

Source: CoinMarketCap

Pi Network Breaks 4-Hour Wedge

Crypto analyst Alpha Crypto Signal reported on February 26 that PI has broken out of a falling wedge on the 4-hour chart, rising above the falling resistance trendline. This is a potential change in market structure. Volume is monitored around the breakout zone; however, the main focus is on the strength of the move.

Source: X

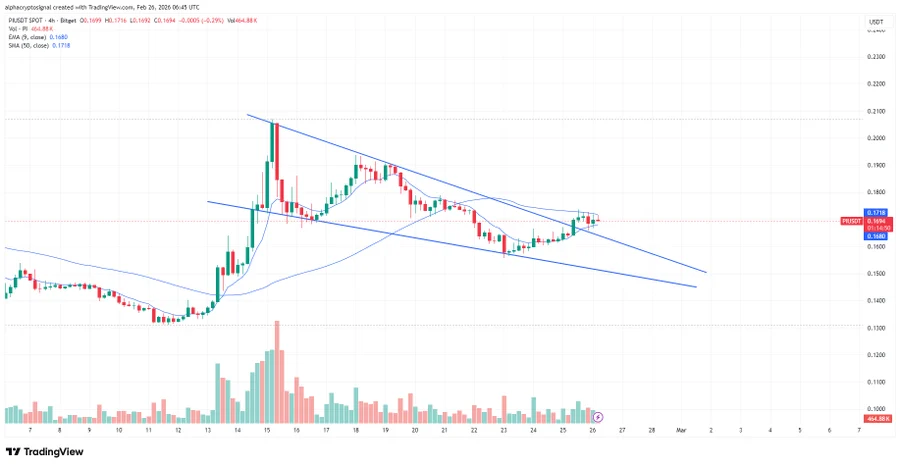
A falling wedge breakout is normally considered bullish, and this is even more pronounced if the momentum is improving. For PI, the price is consolidating above a former resistance turned short-term support. If this holds, a test of a nearby resistance could be considered.

However, if the price fails to stay above the breakout region, it could result in a false breakout with increased selling pressure. At the moment, the short-term momentum indicators suggest that the buyers are in control, although with moderate conviction.

Weekly Chart Indicates Broader Trend Weakness

Moreover, Pi Network (PI) remains below the MA Ribbon resistance levels around $0.20265 and $0.40078. Therefore, it is below the long-term averages. This means the trend has not turned bullish yet. A break above this resistance is necessary to confirm a medium-term reversal.

Source: TradingView

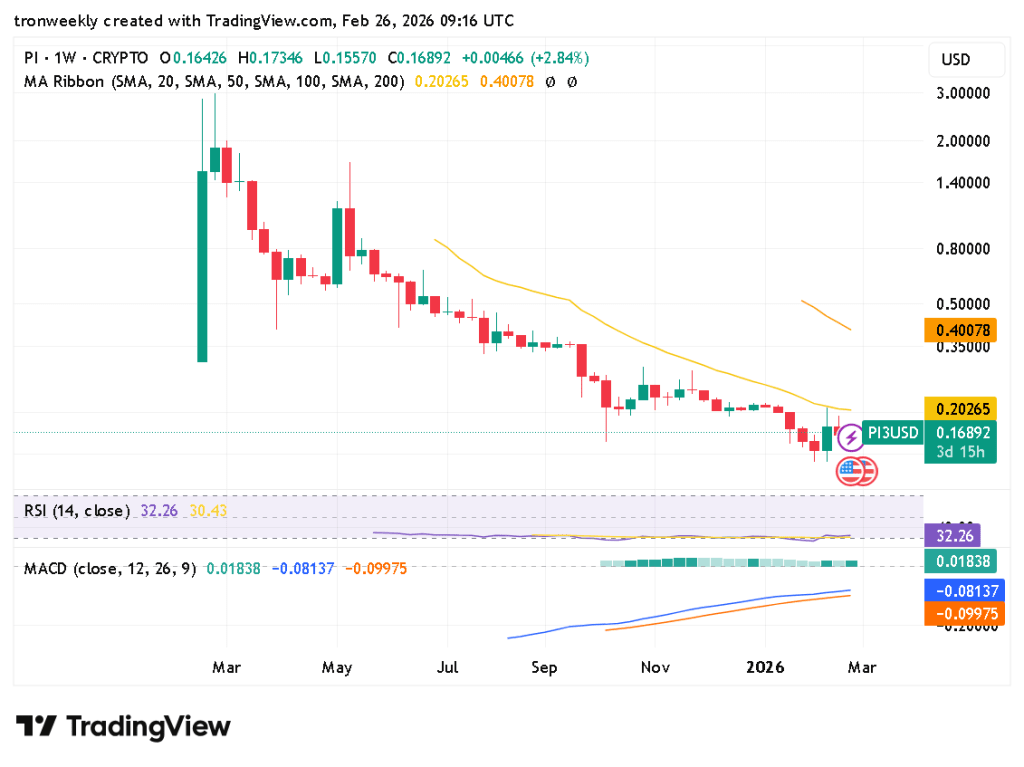
RSI is at 32.26, which is above the signal line of 30.43. This means the selling pressure is ongoing, but the asset is close to the oversold territory. RSI levels close to 30 often signal stabilization, provided buying pressure increases.

The MACD suggests a patient’s recovery. The histogram shows a positive value of 0.01838. The MACD line remains below zero at -0.08137 after crossing above the signal line at -0.09975.

Also Read | Solana Signals Volatility Explosion Near Wedge Apex: Bulls Watch $100 Target

Pi Network Faces Near-Term Test

In the near term, the next level to watch for Pi Network is the falling wedge breakout level, which it needs to remain above. If it can accomplish this, it will likely challenge the next level of resistance at the $0.20 level, which is also the upper bound of the consolidation.

However, if the token loses its current support, the breakout may be negated, and PI may stay below its major moving averages and remain bearish. The intraday charts are showing positive signs of improvement, but are still early days.

Also Read | South Korean Police Arrest Suspects Linked to 22-Bitcoin Heist

Filed Under: Cryptocurrency News

About Bena Ilyas

Bena Ilyas is a Global News Correspondent and Market Analyst at Tronweekly with over four years of experience covering global cryptocurrency, blockchain, and Web3 developments. She has written 1,000+ articles for leading crypto news platforms, reporting on Bitcoin, Ethereum, altcoins, DeFi, and global crypto regulation, alongside Web3 trends, Layer 2 ecosystems, and AI-driven crypto use cases. Her work is based on verified sources and fact-based reporting for global market participants.

Primary Sidebar

Recent Posts

  • Bitcoin’s Viability: Dalio Backs 2025 Gold Warning May 12, 2026
  • Grayscale Files Zcash ETF Plan for NYSE Arca Listing May 12, 2026
  • Strategy Bitcoin Selling Leads to Buying More: 20 BTC Bought, 1 Sold May 12, 2026
  • Solana’s Alpenglow Upgrade 2026: Powerful Fix for MEV Risks May 12, 2026
  • XRP Ledger Foundation’s 1 Massive Leadership Power Move May 12, 2026

Footer

News

  • Latest News
  • Altcoin News
  • Bitcoin (BTC)
  • Blockchain
  • Tron (TRX)
  • World

Digest

  • Meet the Founder
  • Price Winning Article
  • DeFi
  • Cyber Security
  • Crypto Scam

Industry

  • Project Review
  • Technology
  • Fintech
  • Tron Exchange
  • New in Town

Tron Universe

  • Event and Tron Parties
  • New in Town
  • Tron Tokens

FOLLOW US

  • Facebook
  • Telegram
  • Twitter
  • Linkedin

Subscribe US

Editorial Policy | Privacy Policy | Disclaimer | Terms and Conditions | Masthead

Copyright © 2026 · Tron Weekly. All Rights Reserved. NOTE: Tron Weekly is an independent crypto news site that adheres to the strict journalism policy anchored on transparency, trust, and objectivity, we have no affiliation with the TRON Foundation, its founder Justin Sun or any other cryptocurrency firm.