
The entire crypto-verse went on to endure a slump after its Halycon days. Polkadot [DOT], Uniswap [UNI] as well as Theta [THETA] emerged as big losers of this daily drop. After catching the eye of the community, Theta went on to nosedive by over 17% in the last 24-hours. Bitcoin [BTC] was finally making progress towards $61K. However, the bears said “no” and took the king coin back to $52K. The overall market cap of the crypto industry also witnessed a drop. Bitcoin once again dipped below the $1 trillion zones and all the other coins followed. Additionally, Tether [USDT] reemerged as the third-largest currency.
Polkadot [DOT] turned several heads as the fairly new coin rose in terms of price and market cap. DOT found its way into the top ten and even stood as the third-largest cryptocurrency for a brief period. At present, DOT’s market cap was at $28.39 billion. The altcoin during the time of writing was noted at $31.06. Furthermore, DOT was drowning in the bearish realm as it was depleting by 9.43% in the last 24-hours.
Polkadot [DOT] One-Hour Price Chart On Binance
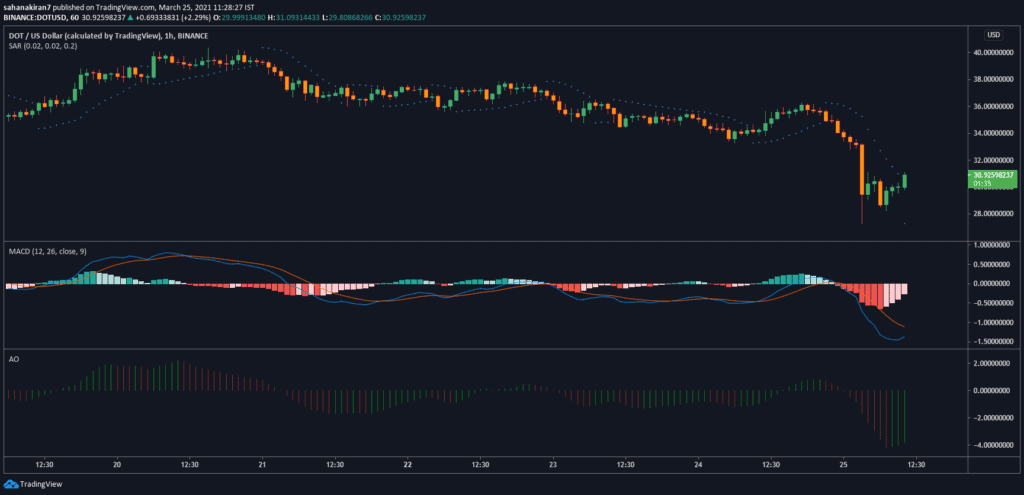
Mixed notions were noted on the short-term price chart of DOT. The Parabolic SAR indicator laid down an array of dotted lines over the candlesticks which are considered to be bearish. However, a formation of a potential line was noted below the candlesticks which would further act as a line of support. While this line would restrict and sudden downfalls, the MACD indicator was still exerting a bearish crossover. Even though the signal line was over the MACD line, both these lines were seen trying to converge for a possible bullish crossover,
The Awesome Oscillator was in favor of the bulls as it rolled out green closing bars.
Polkadot [DOT] One-Hour Price Exhibits Sellers’ Sentiment
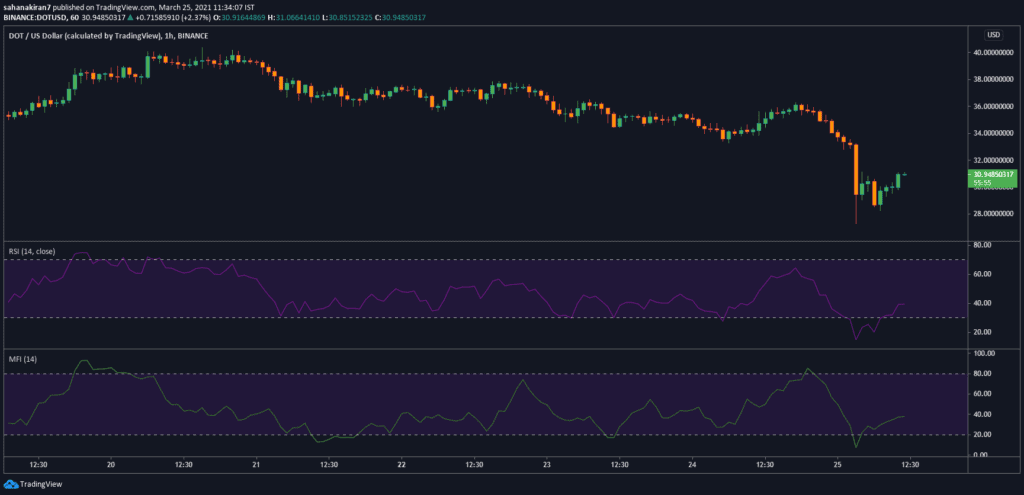
Both the Relative Strength Index and the Money Flow Index indicator were noticed in the seller’s zone. These indicators affirmed that DOT was recovering from being oversold, earlier today.