Render (RNDR) is experiencing a volatile phase characterized by contrasting short-term optimism and long-term technical challenges. Despite a 32% price decline in one month, optimism is brewing among retail investors, with notable increases in RNDR holdings. This dynamic reflects short-term confidence and long-term technical concerns surrounding the token’s performance.
Retail investors have shown increased interest in RNDR, with addresses holding between 100,000 and 1 million RNDR tokens, boosting their balances by 14.54%. Smaller holders, with 1 to 10 tokens, have similarly increased their holdings by approximately 10.8%. This surge in retail activity suggests a growing confidence in the token’s potential, hinting at a possible market rebound.
Further optimism stems from the Market Value to Realized Value (MVRV) Ratio, currently at -20.57%. This negative MVRV suggests a potential buying opportunity, as similar levels in the past have often preceded price rallies. This metric points towards possible price targets of $8.58 or even $9.45 in a bullish scenario, reflecting a hopeful short-term outlook for RNDR.
RNDR Faces Potential Bearish Reversal Signal
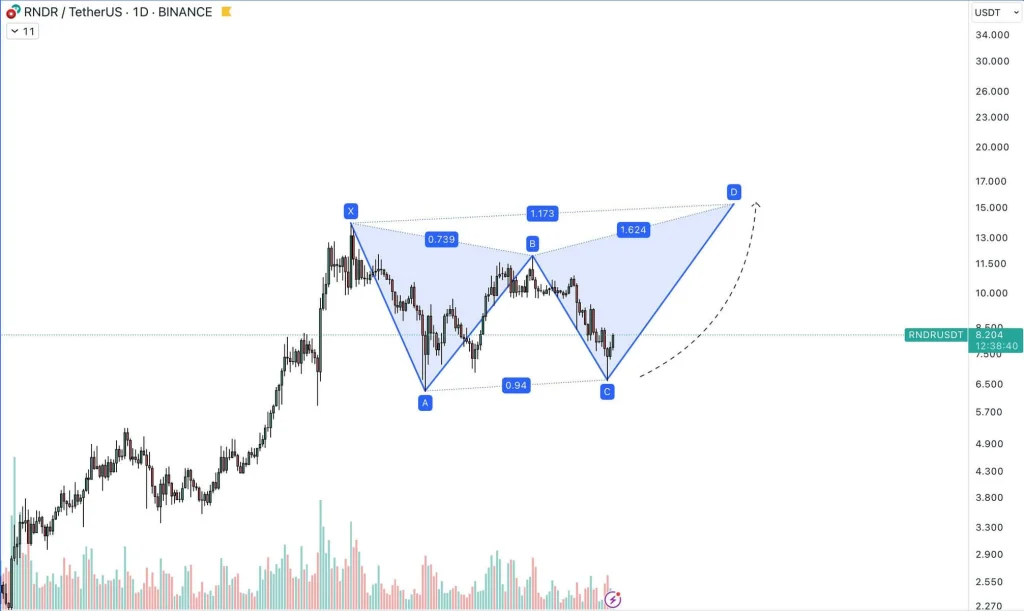
Contrasting the optimistic retail sentiment is a bearish technical analysis perspective. A prominent crypto analyst, Shelby, has identified a Bearish Bat Harmonic pattern on the RNDR/USDT daily price chart on Binance. This specific formation, used to predict reversals, suggests that it might face a downward trend after a potential peak at around 15 USDT.
The Bearish Bat pattern starts at point X, moves up to point A, retraces to point B (a Fibonacci retracement of 0.739), extends to point C (a Fibonacci extension of 0.94), and projects a rise to point D (a Fibonacci extension of 1.624). Shelby’s analysis suggests that a bearish reversal is expected after reaching point D, indicating a potential decline in its price.
Currently, RNDR is in the BC leg of this pattern and moving towards point D. Shelby’s analysis, underscored by the Harmonic Bat pattern and Fibonacci ratios, anticipates a bearish reversal upon reaching the projected peak, a critical signal for cryptocurrency traders. This bearish sentiment is further supported by the daily chart’s Exponential Moving Averages (EMAs), which remain above the current price, reinforcing the downtrend.
As of now, RNDR trades at $7.49, reflecting an 8.1% decline in the last 24 hours. Despite this, trading volume has increased by 1.23%, reaching $209.56 million. For short-term traders, the critical level to watch is $7.17. Maintaining a price above this point could trigger a rally towards the initial resistance level of $8.25. Conversely, a drop below $7.17 might lead to further declines towards the second support level at $6.91.
Render (RNDR) is at a pivotal moment, with retail investors showing increased confidence amidst bearish technical signals. While short-term optimism exists, long-term technical analysis suggests caution, making it crucial for traders to closely monitor key price levels and market trends in the coming days.
Related Readings | Shiba Inu’s Milestone Surge in 2024: Crypto.com Visa Card Acceptance