- The breaking of an important resistance level is now giving $SEI the basis to rise to $0.30.
- A breakout to $0.30 may lead to a temporary pullback, which could be appealing to investors who are yet to enter the market.
- Analysis of the technical indicators suggests that SEI may rise to $0.50–0.70 if the current trend is sustained.
Crypto analyst Michaël van de Poppe has expressed optimism about the cryptocurrency SEI ($SEI) after a major technical breakout, indicating that there are prospects for upward movement. Van de Poppe tweeted on X that $SEI has managed to break an important resistance level, and he now believes this action will initiate a move up to $0.30.
He anticipates that the next significant milestone that this cryptocurrency will achieve in a few days or a couple of weeks will be the $0.30 price point. When an asset breaks through a resistance level (which previously acted as a ceiling) and establishes a new level of support at this previously held resistance value, this is known as a “break and flip.”
Looking into SEI, it is evident that the asset has moved above a significant price level around $0.20, using that point as support, and is now gaining momentum as it moves forward.
SEI Pullback Expected After Hitting $0.30
$SEI is indeed expected to rise to $0.30, but Van de Poppe expects a pullback or correction afterwards. This is normal in the market, as more traders will endeavor to cash out, thus also causing others to begin to sell the token.
However, he also observes that this pullback may be just enough for new investors to jump in before SEI begins to pick up its pace again. The analyst is convinced that its next key price range will be between $0.50 and $0.70.
Chart Shows that $SEI’s Future Growth is Positive
The chart used in van de Poppe’s post is a helpful representation of this forecast. The chart represents the token’s price plotted against time, and volume bars are below. The price has just undergone a strong upward momentum on the backdrop of having been in a sideways trend and slowly rebounding and is targeting the $0.30 mark.
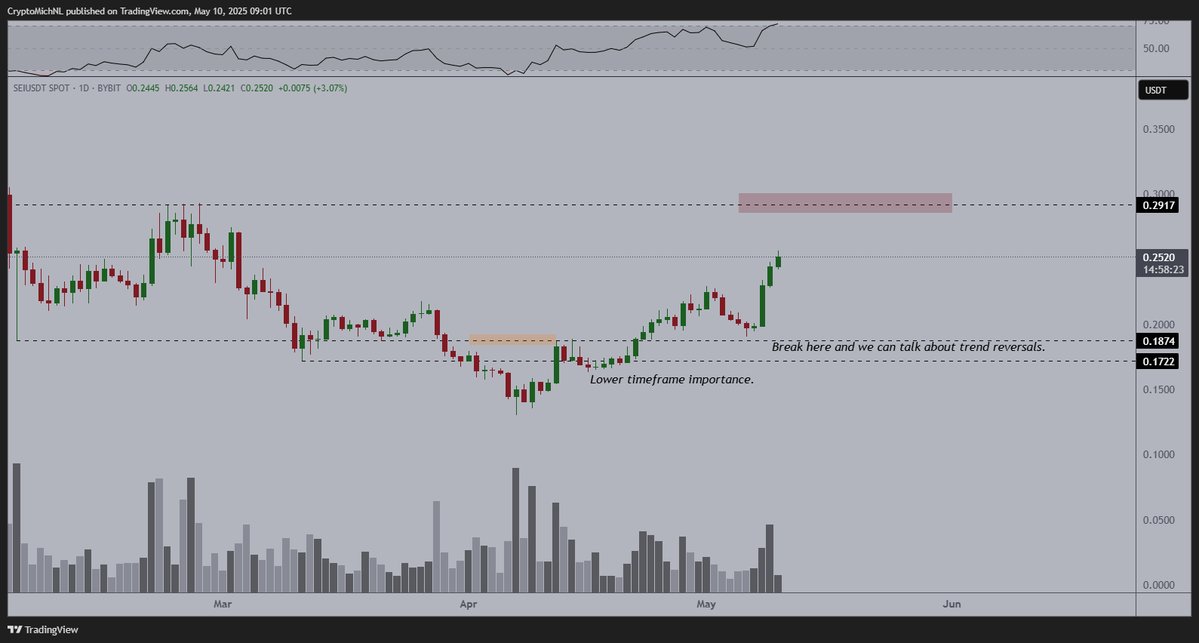
Source: X @CryptoMichNL
On the chart, points representing earlier highs and lows in prices are marked, and a red border around the $0.30 figure indicates the predicted area of resistance. The area upon which the indicators point to as being important includes the line on the chart labeled “Break here and we can talk about trend reversals”, which states that crossing this line is what has prepared the ground for the anticipated bull run.
Related Reading | Solana Price Analysis: SOL Targets Breakout Above $175 Resistance