- Shiba Inu (SHIB) gains 2.55% in the past 24 hours and 5.53% over the week.
- Price hovers around $0.00001023 amid weak overall market momentum.
- Technical indicators show bearish sentiment but a weakening in selling pressure.
- Consolidation continues, signaling a potential breakout setup.
Shiba Inu (SHIB) continues its upward movement, extending modest gains over the past week. The token has risen by nearly 2.55% over the last 24 hours and has recorded a 5.53% weekly increase. This shows growing interest from retail traders even as overall market conditions remain mixed.
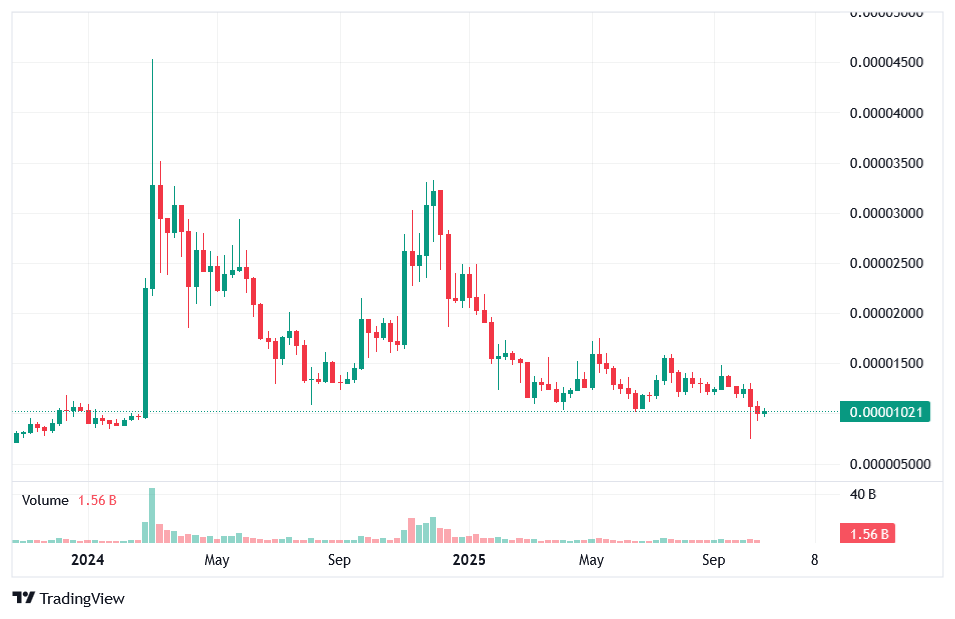
At the time of writing, the token is trading at $0.00001023, with a 24-hour trading volume of $142.73 million, marking a 21.5% decline. The market capitalization currently stands at $6.03 billion, down 2.71%. The dip in trading activity suggests reduced volatility after a brief surge in buying momentum earlier in the week.
Also Read: Shiba Inu Fights to Erase Extra Zero: Can It Break Through $0.00001?
Technical Chart Shows Prolonged Consolidation Phase
The weekly chart highlights Shiba Inu’s ongoing struggle to break out of its consolidation phase. The price remains confined between $0.0000095 and $0.000011, reflecting indecision among traders. For months, SHIB has been moving sideways with limited volatility, unable to establish a clear bullish structure.
The Moving Average (MA) Ribbon, consisting of the 20, 50, 100, and 200 SMAs, slopes downward, confirming a persistent bearish bias. The 20-SMA is positioned around $0.000011, and SHIB must close above this level to signal a potential trend reversal. As long as the price stays below these averages, bearish sentiment dominates the broader outlook.
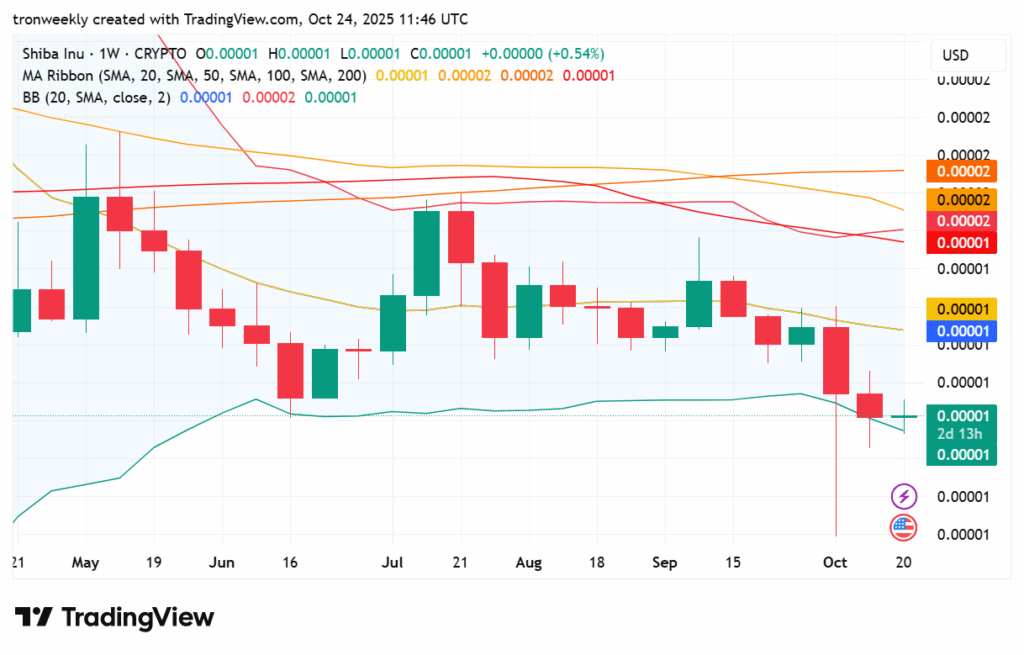
Bollinger Bands (20, SMA) have contracted, indicating a compression in volatility levels, possibly leading to a breakthrough soon. The present level is also close to the bottom band at $0.00001000, indicating a possible turnaround if supporting volumes start flowing in. But a fall below $0.0000095 might attract more selling interest.
Indicators Hint at Weak Momentum but Possible Recovery
The RSI (14) for the Shiba Inu is presently at 39.29, which is weaker compared to its signal line, standing at 45.04, implying weak momentum with mild bear dominance in the market. Since the RSI is on the weaker side but below 50, it means sellers are dominating the market, but it is yet to reach the oversold level, which could see a possible stagnant market with a possible bounce if the usage of funds increases.
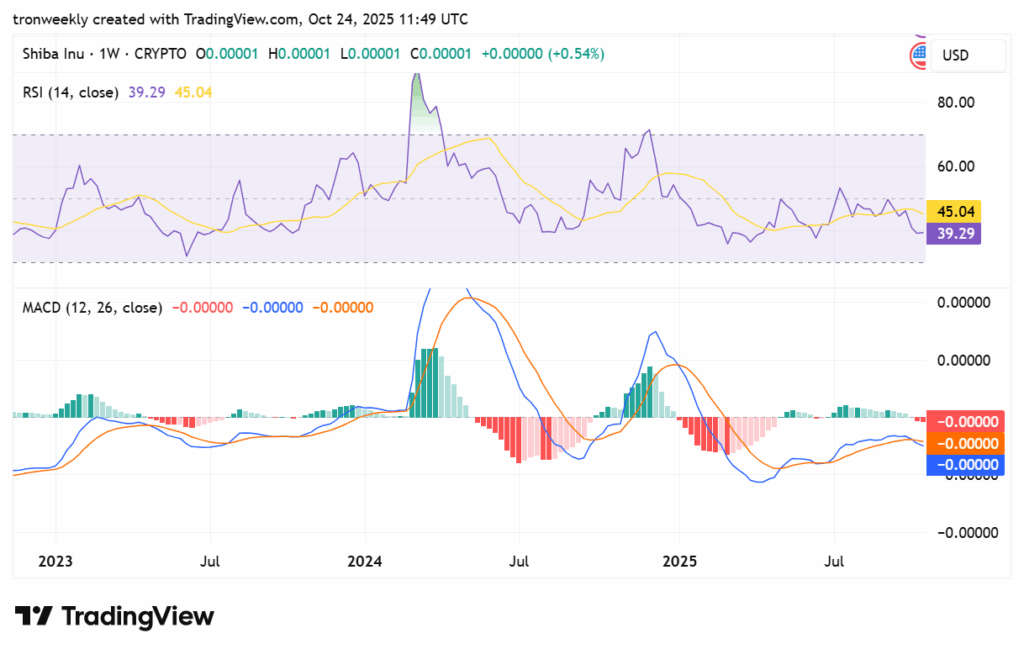
The MACD forms a slightly bearish pattern with the MACD line nearing the zero level, coupled with a weak display by the histogram with small red bars indicating bearish momentum weakening, with an approaching bullish crossover in the coming days if the trend continues. In this case, the overall market trend for Shiba Inu is in a state of consolidation, waiting for a breakout trend.
Also Read: Shiba Inu’s 9M% Challenge: Can It Survive the Surge?