
SHIB price is moving inside a bullish ascending triangle, holding higher lows as buyers defend the rising trendline. Resistance is still limiting upside momentum, while RSI and MACD show improving strength. However, lower volume and rising open interest reflect cautious trading as the market waits for a breakout signal.
SHIB Price Builds Strong Breakout Structure
SHIB price on the 12-hour timeframe continues forming a bullish ascending triangle after recovering from the March bottom near $0.00000520.
Price is currently trading around $0.00000651 while respecting the rising trendline support. Buyers continue defending higher lows, showing strengthening momentum as resistance pressure increases toward breakout territory ahead.
The main resistance zone remains between $0.00000690 and $0.00000700, where sellers previously rejected upward moves several times.

According to crypto analyst Elja, a confirmed breakout above this region could accelerate bullish momentum toward the immediate targets of $0.00000740 and $0.00000760. Sustained buying pressure may extend gains further in the coming sessions.
The ascending trendline near $0.00000620 remains the key support, maintaining the bullish structure. If the SHIB price loses this level, SHIB could retrace toward the $0.00000590 and $0.00000570 support zones.
However, maintaining higher lows above trend support keeps the broader short-term outlook bullish for traders currently.
Also Read: Shiba Inu (SHIB) Price Analysis: Falling Wedge Pattern Signals Potential Breakout
Bullish Indicators Strengthen SHIB Trend
Momentum indicators continue to support buyers. RSI for Shiba Inu is now trading at the level of 60.34, whereas RSI MA is trading close to the level of 54.40, pointing towards increasing bullish strength on the 2-day chart timeframe.
The RSI continues making higher highs above the neutrality zone of 50, indicating active buyers in the market.
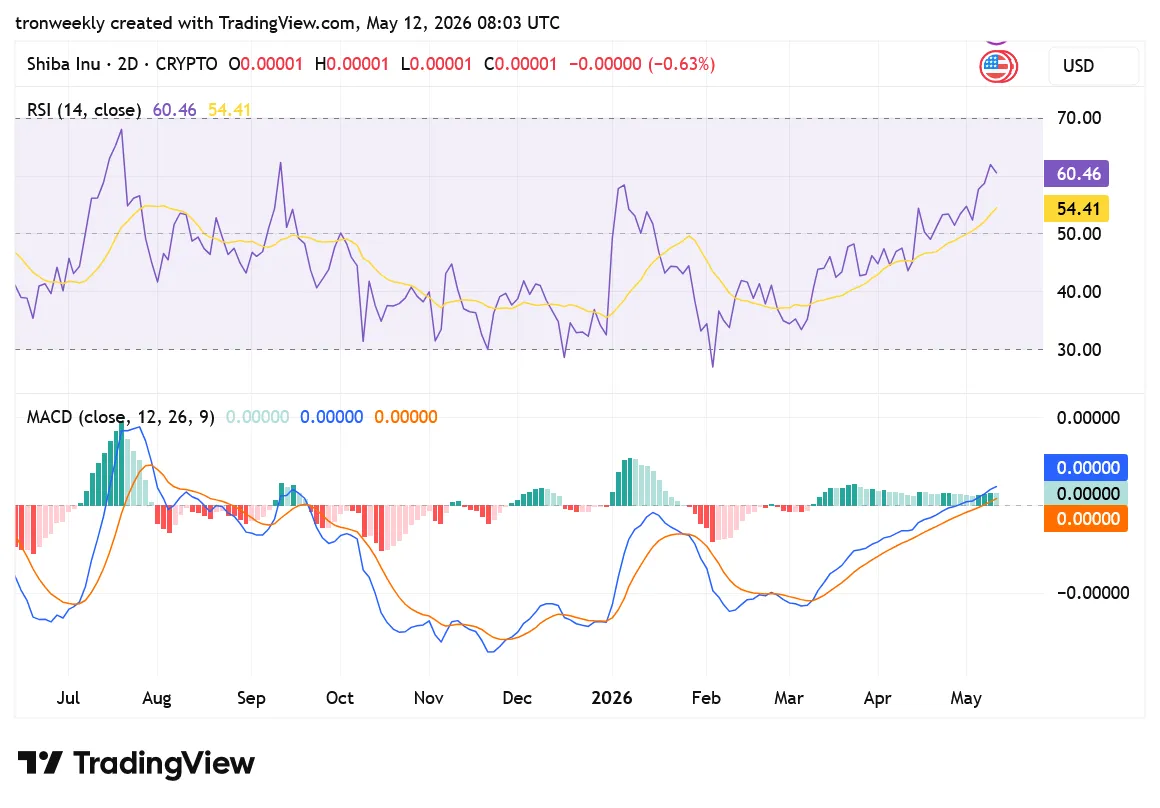
The MACD technical indicator suggests rising bullish momentum because the MACD line stays higher than the signal line around the zero level.
The green histogram bars are increasing consistently, indicating continuous accumulation of bulls’ positions. A clear MACD crossover will prove the potential for bulls’ continuation in further sessions.
Volume Drop Contrasts Rising Interest
According to CoinGlass data, the chart reveals that SHIB witnesses continuous speculative surges, which later cool down after some time.
Demonstrating that traders had a high interest in the asset before its liquidity ran out. Its volume was lower by 30.56%, amounting to $165.96 million.
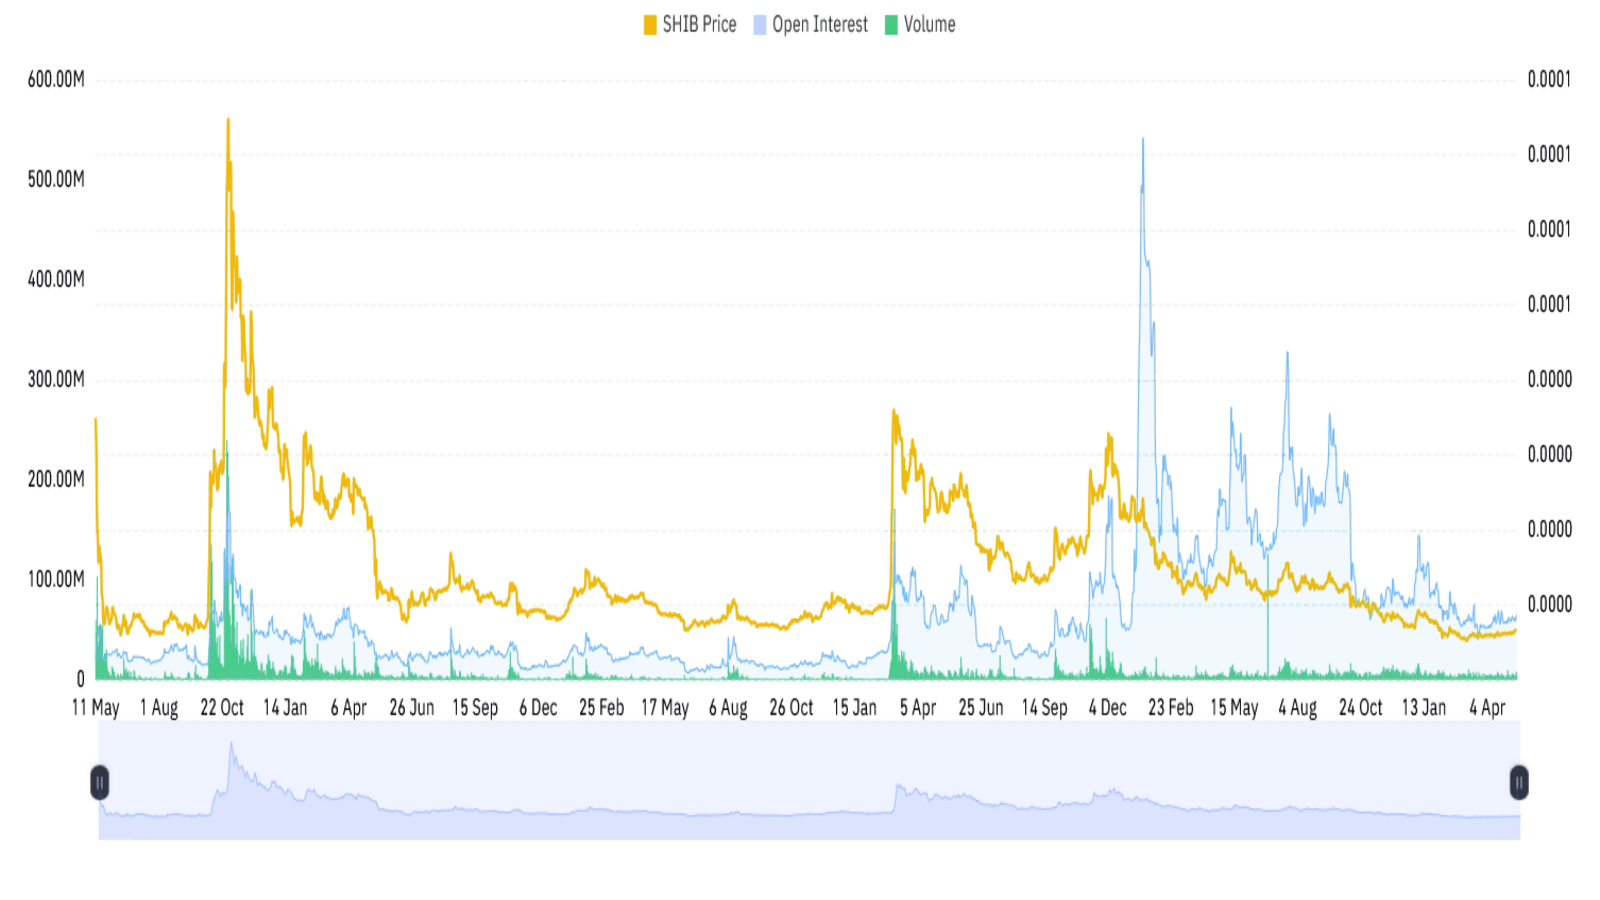
As open interest rose by 2.91% to $64.79 million, and prices continued to fall slowly, this could indicate that leverage trading is still being done, but there’s less excitement.
This article contains market analysis and price predictions. These are not guarantees. Crypto markets are volatile. Always DYOR. Not financial advice.
Also Read: SHIB Added to SBI Lending Program With 2%-5% APY Range.