- Analysts point out to the existence of a bullish wedge pattern that can raise SOL to $258.
- Major Fibonacci levels and support areas feature a perfect area to buy.
- Although Solana is currently weak in the short term, the longer-term momentum says that there is a breakout to come.
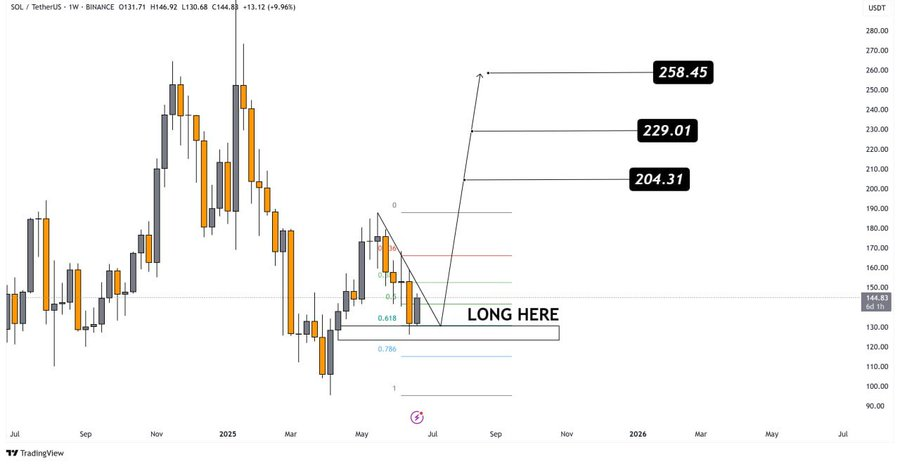
Crypto analyst group Rose Premium Signals states that Solana (SOL) might be preparing to gain momentum in a super bullish rally. They indicated that Solana is exhibiting signals of a bullish breakout, given a pattern that is forming on the weekly chart known as a descending wedge, a formation that usually results in a price rise.
Another aspect that is noted in the analysis is that SOL is now encountering a major demand area that corresponds to a critical Fibonacci scenario (the 0.618 level). Traders would frequently identify a possible reversal point using this level, and in that regard, the level often suggests that a big increase in price could be possible.
SOL in “Long Zone” Before Breakout: Analyst
The analysts found what they termed an ideal LONG zone, which is simply a good zone to look at as an entry point. Based on this zone, they feel that SOL has the potential to start a rally, provided that the price breaks out of the wedge formation.
Source: X
Their forecast also includes upward targets that include $204.31, $229.01, and $258.45. Their post provides a clear representation of this setup. The label “LONG HERE” refers to the demand zone, which appears at the point between the 0.618 and 0.786 retracement points of Fibonacci.
Also Read: Solana Forecast 2025: Will SOL Break $300 or Fall Below $130?
Technical Indicators Suggest SOL May Find Support Soon
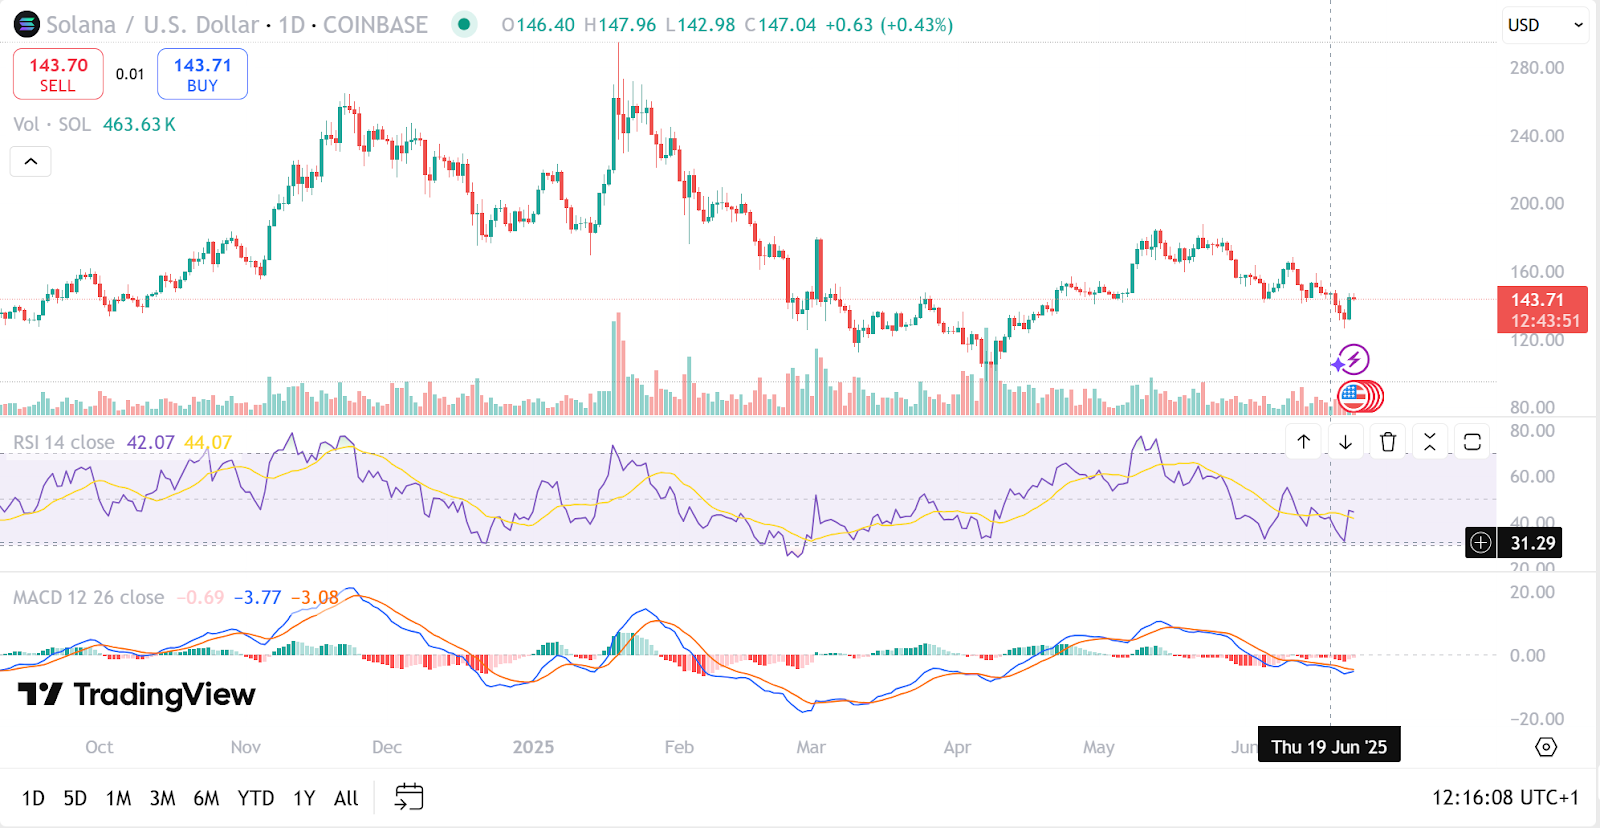
Meanwhile, looking at the daily chart of SOL on Coinbase, the price is currently around $143.71, showing a slight gain on the day. However, the market has been in a downward trend recently, and technical indicators are mixed.
Source: TradingView
The RSI is sitting near 42.07 and heading toward the oversold zone. This suggests that while selling pressure has been high, the token might be nearing a level where buyers could come in.
The MACD shows a bearish signal as well, with the MACD line still below the signal line, although the gap is narrowing.
Analysts Remain Optimistic on SOL’s Long-Term Setup
Despite these cautious signals on the daily chart, the overall weekly structure remains bullish if the wedge pattern plays out as expected. The wedge’s narrowing shape and historical support zones are giving hope to traders that a breakout could happen soon.
If that breakout does occur, the move toward the analyst’s targets, especially the ambitious $258.45 mark, could bring significant upside for SOL holders.
Also Read: Solana Forecast 2025: Will SOL Break $300 or Fall Below $130?