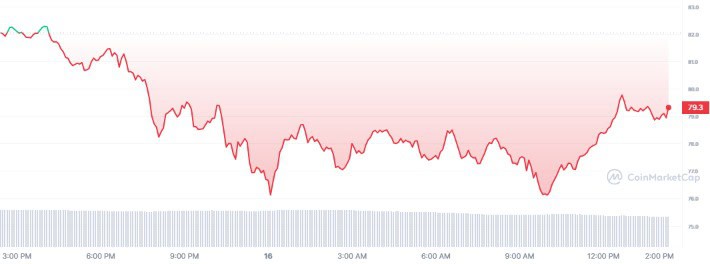
Litecoin (LTC) recently underwent a decrease in value, dropping from its recent high of $112 to $71. However, despite this decline, LTC remains poised for potential significant growth in the long term. This optimism stems from the anticipation surrounding the upcoming Bitcoin Halving, which is expected to trigger a substantial upward movement in the cryptocurrency market.
At the time of writing, the price of Litecoin stands at $79.23, accompanied by a 24-hour trading volume of $1.36 billion and a market capitalization of $5.90 billion. Over the past 24 hours, LTC has experienced a decrease in price by 3.28%.
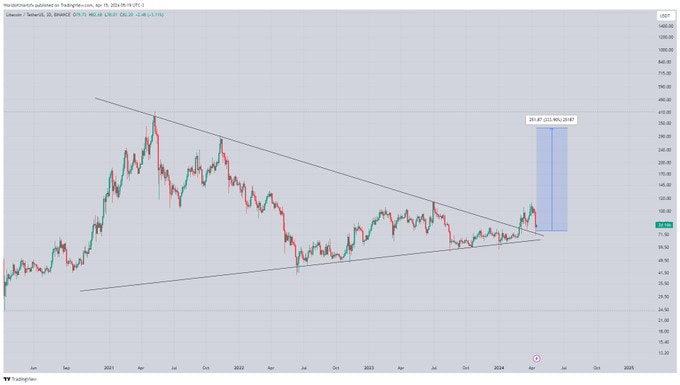
Litecoin (LTC) Potential to Hit $250
Despite encountering a brief downturn in its price, Litecoin (LTC) appears to be on the brink of a notable ascent. This assessment comes from World Of Charts, a respected crypto analyst renowned for insightful market predictions.
Litecoin has emerged as an appealing prospect for investors who may have previously overlooked it. Its recent rebound from a significant trendline suggests resilience and potential for growth. Despite recent fluctuations, there remains a strong belief among analysts and traders alike that LTC is positioned for a substantial price surge.
The analyst predicts a move towards the $250-300 range in the coming months, reflecting a consensus among market observers. This projection is rooted in various factors, including ongoing developments within the cryptocurrency space, potential adoption by mainstream financial institutions, and broader market trends.
However, while short-term fluctuations are inevitable in the volatile world of cryptocurrency, the overall trajectory for LTC appears bullish. This sentiment is bolstered by technical analysis, market sentiment, and the broader outlook for digital assets. As such, many investors view LTC as an asset with significant growth potential shortly.
Litecoin to Hold $68 For Upside Move
Litecoin’s price movement seems confined to a relatively steady horizontal trend channel. This suggests that investors are grappling with uncertainty, eagerly awaiting clear indicators of the cryptocurrency’s future trajectory. Should Litecoin break out of this horizontal trend channel in an upward direction, it would likely be interpreted as a positive signal, indicating potential upward momentum in its price. Conversely, a downward break would signal a negative trajectory.
In the short term, Litecoin has already breached a support level, signaling a bearish trend in its immediate trading range. This breach of support adds weight to the negative sentiment surrounding short-term trading prospects.
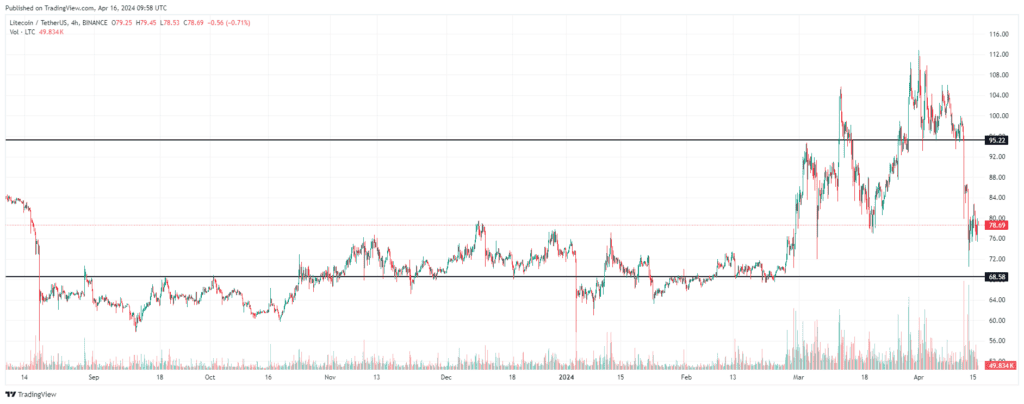
Looking at specific price levels, Litecoin appears to have support at around the $68 mark, meaning that it tends to find buying interest and upward momentum around this price point. Conversely, resistance is observed around the $95 level, indicating a point at which selling pressure tends to mount, hindering further price increases.
Related Reading | Render’s (RNDR) Bullish Trend: Analyst Eyes Potential Surge to $100