• Skip to primary navigation
  • Skip to main content
  • Skip to primary sidebar
  • Skip to footer
  • About us
  • Write for us
  • Terms and Conditions
  • Privacy Policy
  • Disclaimer
  • Contact
  • All Posts
  • Advertise

TronWeekly

Crypto World News

  • Home
  • Education
    • Best TRON Wallets
    • Beginner’s guide to TRON
  • Opinion
    • Tron Tokens
    • Market Analysis
  • Industry
    • Tron Exchange
    • Project Review
  • Press Release
  • Advertise
  • About us
    • The Team
    • Editorial Policy
    • Write for us
    • Privacy Policy
    • Disclaimer
    • Terms and Conditions
    • Contact
You are here: Home / Opinion / Market Analysis / The Graph Breaks Resistance At $0.9458, Sets New Monthly High
The Graph

The Graph Breaks Resistance At $0.9458, Sets New Monthly High

October 26, 2021 by Parth Dubey

The Graph token has proved to be a great investment for this month, rising by more than 64% this month. If the current trend continues, we can see a new all-time high by the next month. We saw the token create a new monthly high at $1.0727.

The data from CoinMarketCap shows that the trading volume of the token rose by 223.38% in the last 24-hours with a 16.43% surge in the market capitalization. The performance of The Graph token has been bullish since the past few days, with a 30-day low of $0.6201 and 30-day high made today at $1.07.

Following the trend of Bitcoin, the majority of altcoins have been bullish with Solana almost reaching a new all-time high.

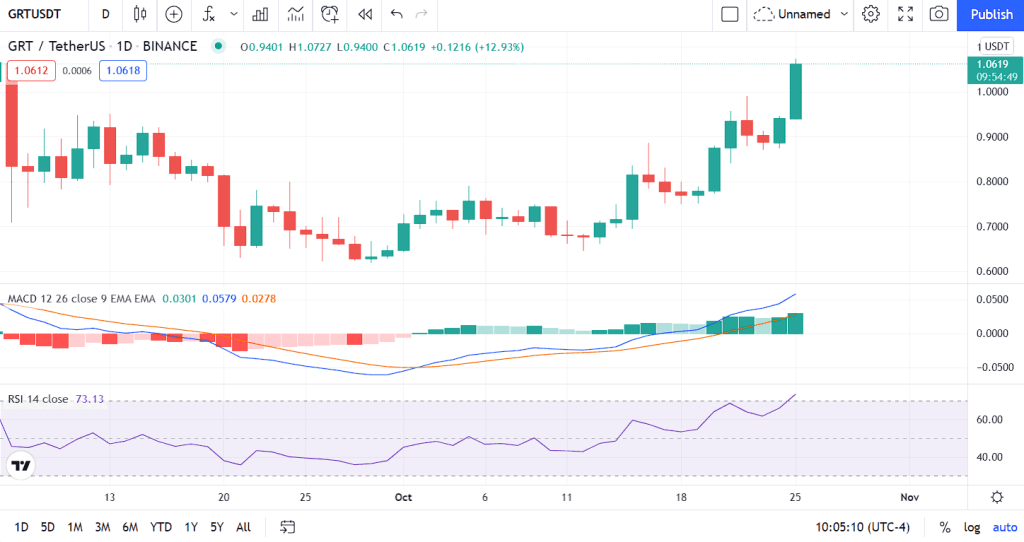
The Graph price analysis on the daily chart using technical indicators

The technical indicators suggest that The Graph token will remain bullish in the short term as the price action has breached the upper end of the Bollinger Bands.

Furthermore, the price action is progressing above the 50-day and 100-day Moving Averages, suggesting that these levels will act as support in the near term.

The Graph price analysis
The Graph price analysis on the daily chart by TradingView

The RSI indicator shows that The Graph token has entered the overbought zone, i.e., the line has entered the region above the 60-level.

The price levels have surged after the MACD indicator witnessed a bullish crossover, wherein the MACD (blue) line crossed over the signal (orange) line. The histogram is now filled with green bars, i.e., the buying pressure has defeated the selling pressure.

image 12
The Graph price analysis on the daily chart by TradingView

Final Verdict

The GRT token has been bearish in the past 24 hours, making a high of $1.07 and a low of $0.8768. Therefore, the conclusion for today’s analysis is on a bullish note, with higher prices possible in the short term.

Filed Under: Market Analysis, Altcoin News Tagged With: Crypto trading, cryptocurrency trading

Primary Sidebar

Recent Posts

  • Is Shiba Inu Easy to Buy and Sell in Europe? May 21, 2022
  • OpenSea Deploy New Web3 “Seaport” Marketplace On Ethereum May 21, 2022
  • Dogecoin co-founder states the obvious yet again May 21, 2022
  • Bitcoin to shine bright like a diamond May 20, 2022
  • Singapore Court, Following a Dispute, Barred the Sale of Bored Ape Yacht Club NFTs May 20, 2022

Footer

News

  • Altcoin News
  • Bitcoin News
  • Blockchain
  • Tron News
  • World

Digest

  • Meet the Founder
  • Price Winning Article
  • DeFi
  • Cyber Security
  • Crypto Scam

Industry

  • Project Review
  • Technology
  • Fintech
  • Tron Exchange
  • New in Town

Tron Universe

  • Event and Tron Parties
  • New in Town
  • Tron Tokens

Follow Us

Subscribe US

Copyright © 2022 · Tron Weekly. All Rights Reserved. NOTE: Tron Weekly is an independent crypto news site that adheres to the strict journalism policy anchored on transparency, trust, and objectivity, we have no affiliation with the TRON Foundation, its founder Justin Sun or any other cryptocurrency firm.