
Toncoin price maintained strong weekly momentum despite facing short-term selling pressure during the last 24 hours. The market showed signs of consolidation after a sharp rally, while RSI and MACD indicators continued supporting the broader bullish trend. Key support zones remain critical as traders monitor a possible breakout above major resistance levels.
Toncoin Weekly Momentum Stays Strong
Toncoin price continues to show strong weekly momentum despite short-term weakness. Over the past 24 hours, TON has declined nearly 4.93%, reflecting temporary selling pressure.
However, on a broader scale, the token has posted an impressive 66.39% weekly gain amid improving market conditions and rising trader participation.

According to CoinMarketCap data, the token is trading at $2.28. The 24-hour trading volume stands at $597.93 million, reflecting a 3.07% daily decline.
Meanwhile, the market capitalization is valued at $6.13 billion, marking a 4.94% drop over the same period despite strengthening overall momentum.
Also Read: Toncoin Price Prediction: 32% Surge Ahead Sparks Market Frenzy
Key Support And Resistance Levels Explained Clearly
According to the crypto anysalt Altcoin Sherpa, the Toncoin price chart shows a strong bullish rally followed by a clear distribution phase.
The Toncoin price surged aggressively toward $2.90, then formed lower highs, signaling weakening momentum. This shift indicates smart money is likely taking profits while late buyers get trapped near the top region.
Currently, the price is struggling around $2.28, which serves as the lower base of support after being tested many times.

A breakdown below this level would send the rate to the next level of demand at $2.09, and if this fails, the rate could move down further towards $1.90.
From the general pattern, it shows that there will be a short-term bearish pullback in a more extended bullish trend.
If the price manages to rise above $2.52, it will show that the bulls are back in control. However, until then, one needs to exercise caution.
RSI And MACD Maintain Bullish Structure
The technical indicators remain supportive of the overall bullish trend even in light of evidence that the momentum may be waning.
The RSI indicator reveals bullish momentum, hovering around the levels of 67.70 and 68.18, and close to the overbought area, but not overly so.
This signals that the buyers continue to be in control of the market, albeit at a somewhat reduced pace following their uptrend.
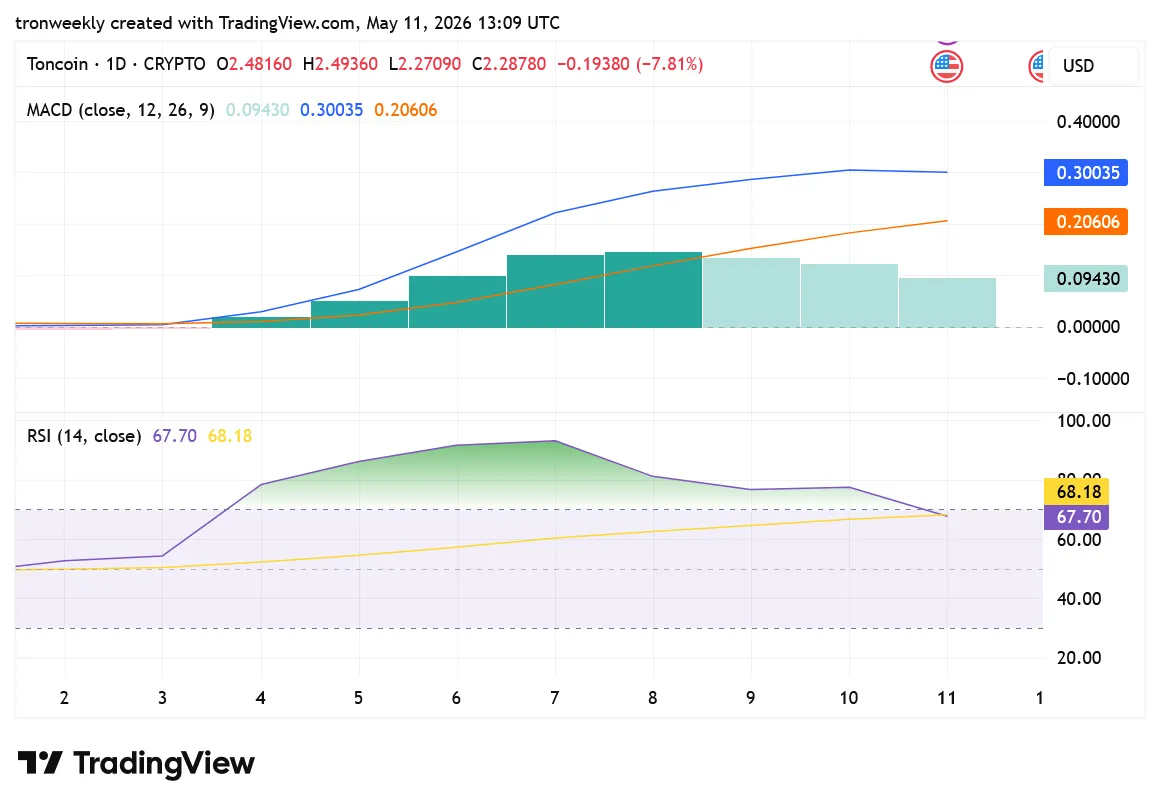
The MACD indicator continues to be bullish with readings of about 0.30035, 0.20606, and a histogram value of 0.09430.
While the increasing gap indicated an increase in momentum, it seems that there is now a slowdown in momentum. However, a bearish crossover has not been witnessed.
This article contains market analysis and price predictions. These are not guarantees. Crypto markets are volatile. Always DYOR. Not financial advice.
Also Read: Toncoin Price Outlook: Can TON Breakout Target $3.00 as Recovery Builds