- Whale activity and outflows drive Toncoin’s recent 23.08% price decline.
- Toncoin’s key support at $3.00 and resistance at $4.00 determine price direction.
- Oversold RSI and MACD suggest potential for short-term bounce if momentum shifts.
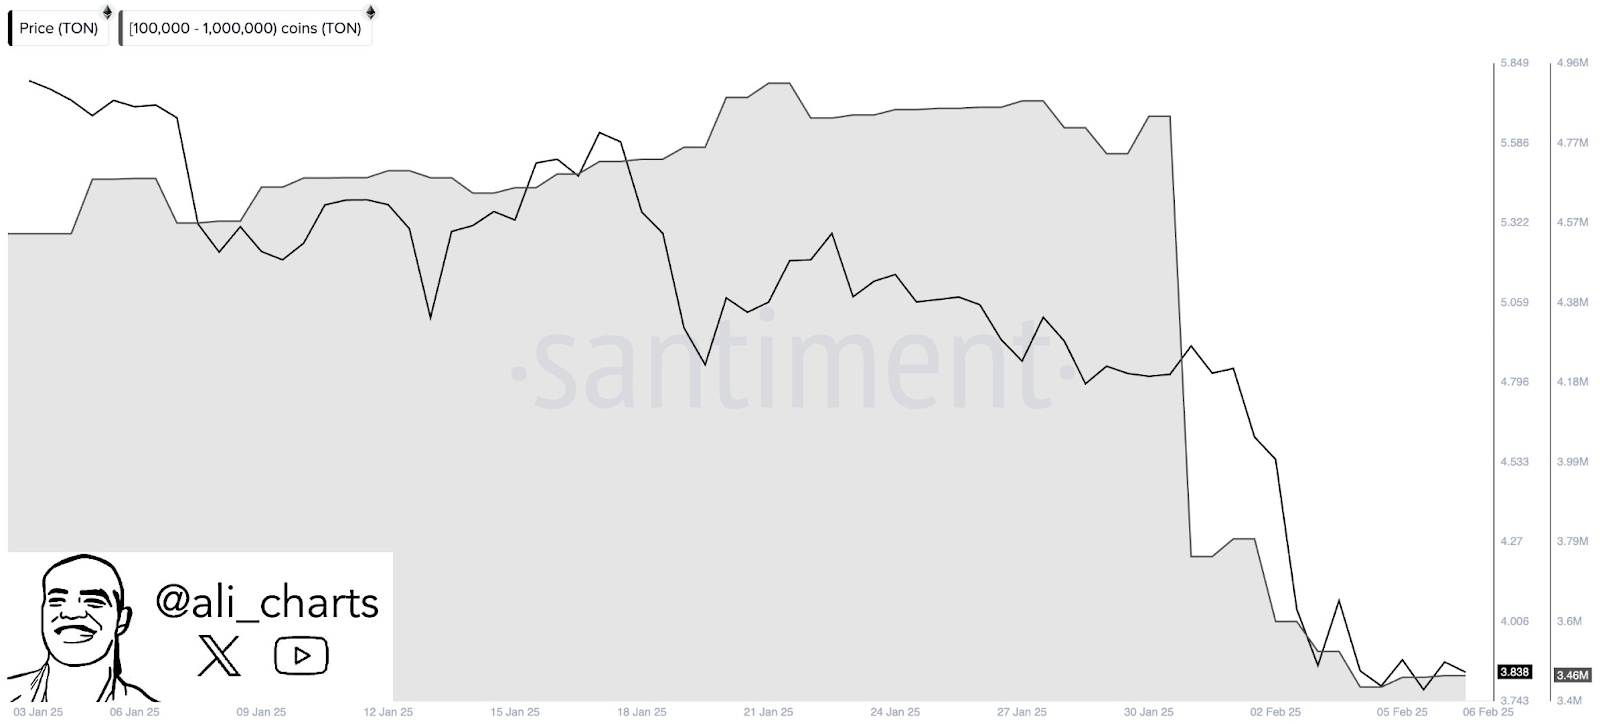
Toncoin (TON) has seen a significant movement of 1.43 million tokens from whale wallets in the past week, according to analyst Ali Martinez. The price has declined by 23.08% over the last seven days, with a 2.30% drop in the last 24 hours.
As of press time, Toncoin trades at $3.78, with a 24-hour trading volume of $208,761,854. The market cap stands at $9.42 billion, with a circulating supply of 2.5 billion TON. Amidst these developments, analysts closely monitor key support and resistance levels to determine potential price movements.
Source: X
Market Trends and Inflow-Outflow Analysis
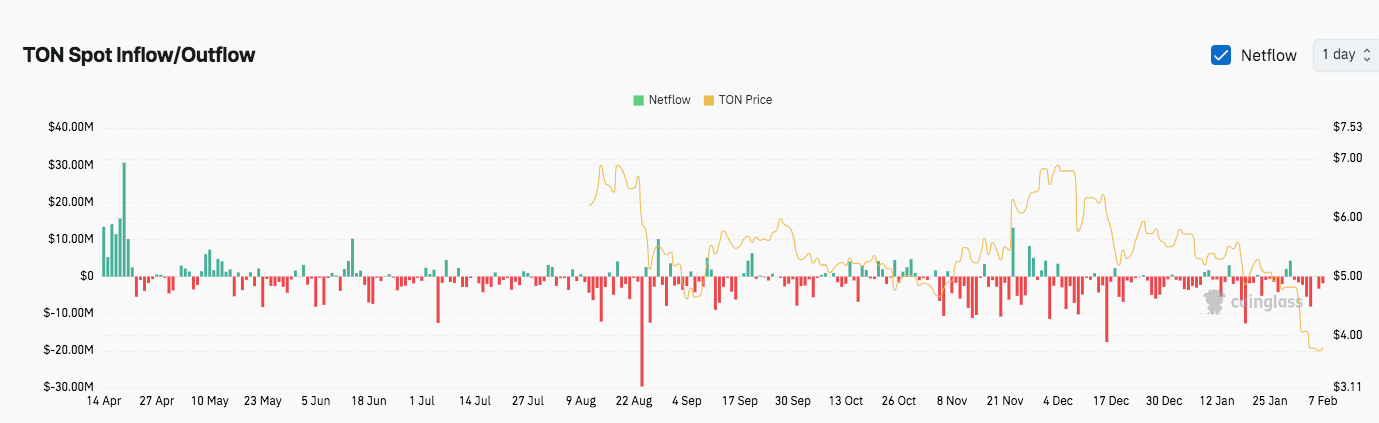
The Toncoin chart highlights fluctuating inflows and outflows, influencing price trends. A notable inflow spike exceeding $40 million in late April signaled strong investor interest. However, significant outflows in late August and December led to price declines from $7.50 to below $5 by February.
Source: Coinglass
In January, a crucial support level of $4 was breached due to persistent outflows, amplifying the bearish trend. Although temporary inflows in November stabilized the price near $6, selling pressure resurfaced, driving prices lower. Recent outflows exceeding $20 million reflect dominant selling sentiment, outweighing occasional inflows that failed to sustain upward momentum.
Key Support and Resistance Levels
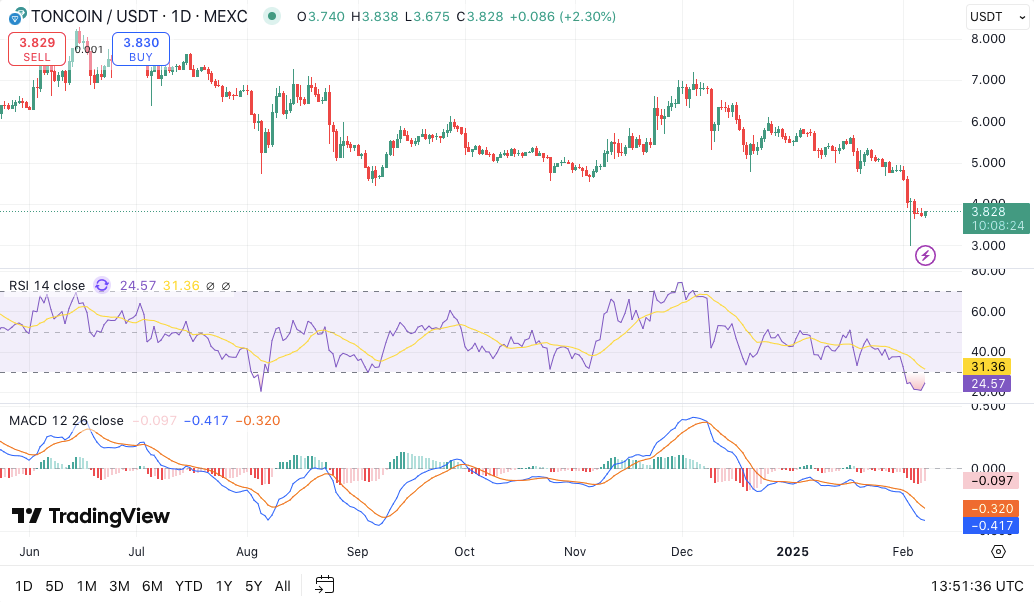
Currently, Toncoin is trading around $3.797, showing slight recovery after a recent drop. The primary support level stands at $3.00, where significant buying interest has emerged in past sessions. A secondary support level at $3.50 has historically acted as a psychological barrier.
On the upside, immediate resistance is seen at $4.00, aligning with recent rejection points. A stronger resistance zone exists at $5.00, marking a historical level where previous rallies failed.
Technical Indicators and Market Outlook
TON/USD daily price chart, Source: Trading view
The Relative Strength Index (RSI) is at 31.27, placing the market in the oversold zone. If buying pressure increases, a short-term rebound could occur. The Moving Average Convergence Divergence (MACD) remains below the signal line, reflecting bearish momentum. A potential crossover could signal a shift if momentum strengthens.