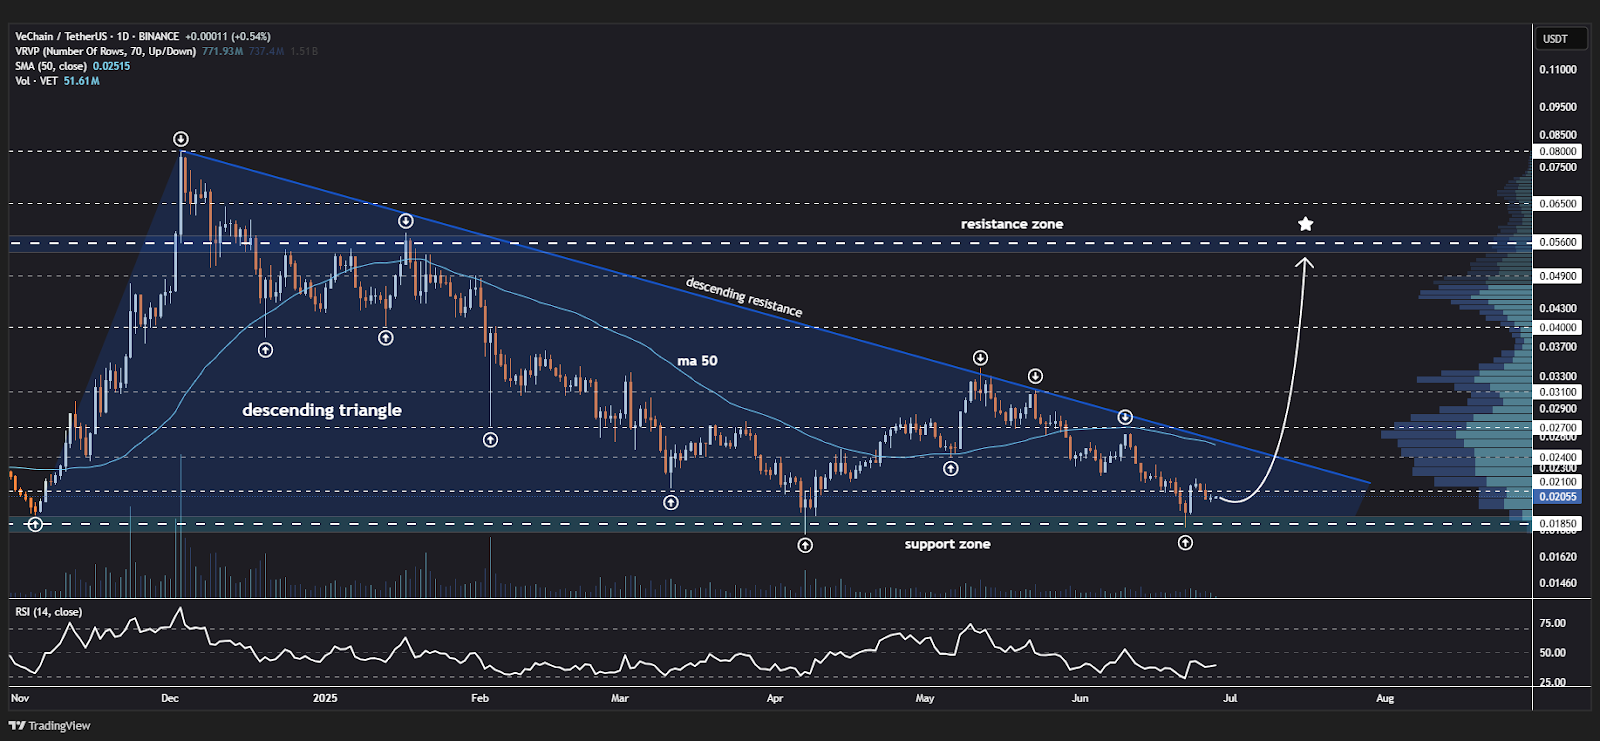
- VeChain bounces from $0.0185 support, eyeing a breakout above descending triangle resistance.
- RSI recovers from oversold, signaling weakening sellers and growing buyer interest.
- Potential VET price targets are $0.024, $0.027, $0.031, and up to $0.056.
VeChain (VET) is showing signs of life after weeks of sideways movement and falling prices. According to an analysis by Jonathan Carter (@JohncyCrypto) shared on X, VET is bouncing from a major support zone near $0.0185 on the daily chart.
Source: X
Also Read | VeChain (VET) on Edge: Will $0.02 Hold or Lead to a Steep Decline?
VeChain Tests Support Descending Triangle Structure
This region has been a support over the past few months, and it is attracting new attention from traders. VET is moving within the descending triangle pattern that usually indicates the possibility of an additional drop in price. However, in this case, buyers are stepping in to stop more declines.
The recent bounce suggests that market participants believe VeChain might be ready for a change in direction. The chart shows a clear descending resistance line that has limited strong upward moves for months.
This line connects lower highs that have pushed the price down repeatedly. At the same time, the 50-day moving average has acted as a barrier. Each time VET got close to this level, sellers took control again.
The recent price action is now creating hope among VeChain supporters. The RSI is experiencing a slight recovery from oversold conditions. This is an indication of sellers growing weaker and buyers becoming interested once again.
VET Eyes Breakout as Critical Resistance Zones Gain Traders Attention
Carter notes that the most probable upside targets stand at $0.024 and $0.027 and $0.031 should the momentum carry on. If a stronger rally is made, the price may go as far as $0.040, $0.049 and even $0.056.
Such targets are previous trading zones of resistance and heavy trading levels. These levels are used by large numbers of traders either as exit levels or even as new entry strategies. Strong supports, however, can become springboards should there be enough buyers.
The technical layout for VET could motivate long-term investors and short-term traders to seek gains. The volume data shows a massive number of trades could happen between $0.027 and $0.040.
This indicates high demand from the market players at these price levels. Although the general direction has been negative, little indicators of strength can accumulate to larger movements when sufficient momentum is sustained.
Also Read | HYPE Price Prediction: Market Turns Bullish and Eyes $43 Resistance