XRP is flashing several bullish technical and on-chain signals that analysts believe could trigger a strong breakout rally toward the $2 mark. Over the past weekend, the crypto managed to climb by about 9%, while investors noted positive movements like funding rates, Bollinger Band compression, and bullish chart patterns.
Despite XRP currently being way lower than its record high of $3.66 recorded in July of last year, analysts claim the recent price behavior is similar to setups observed in previous rallies.
Funding Rates Hint at Potential Reversal
Among the best signs of a bullish move is the funding rate of XRP at Binance. As per analysis by Darkfost, the 30-day funding rate has remained bearish for almost three months, even as XRP has posted gains during the said period.
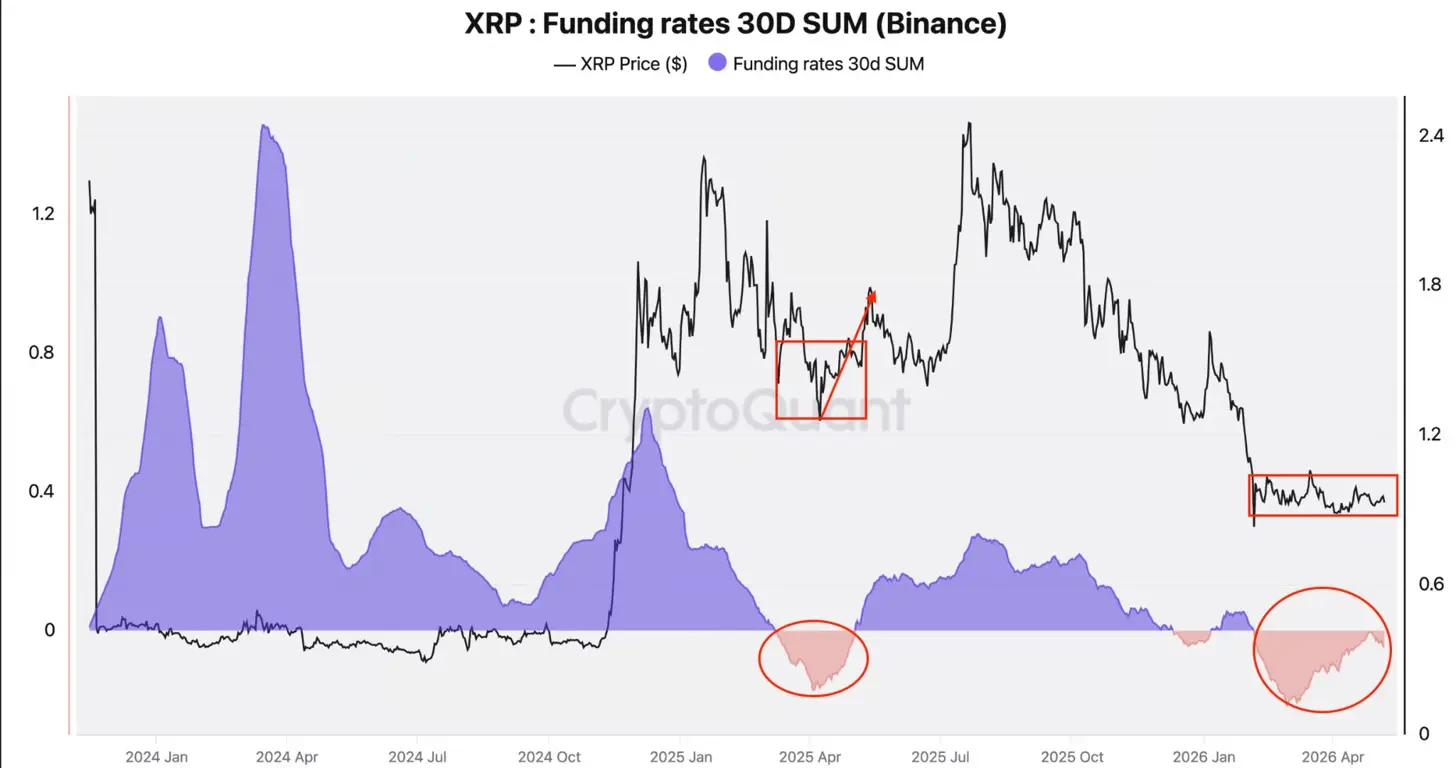
The funding rate is an ongoing payment among those trading long positions and short positions in the perpetual future market. When the funding rate is negative, it means that there is a high position for a downward move. When bearishness reaches a certain point, however, it might trigger a sudden rise in prices.
Darkfost noted that similar setups occurred earlier in 2025 before XRP experienced a strong rebound. In April 2025, XRP traded near $1.25 before eventually rallying over 120% during the following bullish recovery phase. Analysts say the prolonged negative funding environment could now create conditions for another short squeeze if bullish momentum continues building.
Also Read: XRP Price Analysis: Is a Macro Bottom Forming Near $0.93?
Bollinger Bands Signal Major Volatility Ahead
Bollinger Bands, another widely watched oscillator, have compressed to their lowest levels in just under 10 months, according to the XRP chart of the last two days. These bands are widely utilized for measuring price volatility and momentum. The compression of the bands is seen by many as a precursor to a significant price movement.
Based on historical patterns, there have been previous instances where the altcoin has surged due to such a squeeze. Following a Bollinger Bands breakout in July 2025, the altcoin rose by almost 90%. Similarly, in July 2024, it gained more than 70%, courtesy of a similar technical pattern.

According to Analyst Seth, the present instance is part of the “tightest Bollinger Band squeeze in recent years,” and usually, such cases end up having explosive reactions.
Triangle Breakout Targets $2
XRP’s breakout from the symmetrical triangle formation on the daily timeframe is also being watched by the technical analysts. For some time now, the altcoin has been trading inside two lines converging against each other in a symmetrical triangle, which is normally considered a breakout formation. The token has now broken out to the upside by crossing the upper line, with $1.40 becoming potential support for it.
Should XRP manage to hold onto its breakout, there is an expectation that the altcoin could make its way towards the $2.05 price level. That would entail a potential upside of around 40% compared to present price levels.

Technical indicators suggest increasing strength. A bullish crossover above the zero mark was generated by the Moving Average Convergence Divergence (MACD), an indicator often associated with more bullish momentum for the altcoin. According to analyst CW8900, a “full-scale rally” of XRP might just be underway following the token’s reversal at a multi-year support level.
This article contains market analysis and price predictions. These are not guarantees. Crypto markets are volatile. Always DYOR. Not financial advice.
Also Read: XRP Price Analysis: Break Above Resistance Opens $1.4700 Upside Target