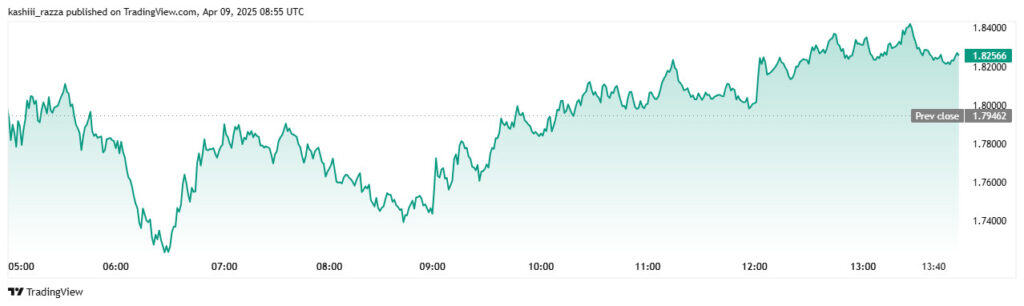
- XRP trades at $1.82, up 1.76%, but still down 15% over the past 30 days.
- Dr. Cat predicts XRP could reach $4.50, assuming no significant drop below $1.69 on the 2-day chart.
- Blockchain Backer suggests XRP’s Wave C correction may end between $1.40-$1.50, signaling a possible recovery.
XRP experienced notable price swings throughout the past week, ranging from $2.30 to $1.60. On Monday, its value plunged below $1.64, followed by a modest rebound to approximately $1.90. At the moment, it is trading at $1.82, which marks a small gain of 1.76%. However, this short-term improvement does not change the broader picture—a 15% price decline over the last 30 days, based on TradingView data.
A widely-followed crypto market analyst known as Dr. Cat believes XRP still has room to grow, despite recent price struggles. He expects the token to reach a minimum of $4.50, even in a worst-case market scenario. According to him, this target could still be achieved even if Bitcoin’s rally ends early and BTC fails to make a new high, instead reaching only $85,000 before falling again.
Dr. Cat’s prediction is based on a technical measurement known as the 1.618 Fibonacci extension level from XRP’s previous price drop. This level supports his $4.50 minimum target. However, he also explained that he would reconsider his outlook only if it closes below $1.69 on a 2-day chart.

XRP May Have Hit Bottom
Dr. Cat believes there’s at least a 50% chance that XRP and the broader crypto market have already reached the bottom. If that’s the case, he expects the next move to be a strong recovery upward. He is closely watching current support levels to determine whether the asset is preparing for a turnaround.
Adding to this view, another analyst, “Blockchain Backer” on the platform X, told his 300,000 followers that XRP is currently in the final stages of a market correction pattern called an ABC correction. This pattern typically consists of three waves that move against the previous trend, often leading to a return to the original direction once the correction ends.
Blockchain Backer noted that it has now entered the third wave, or Wave C, of this pattern. His chart analysis on the 4-hour time frame shows that the price is declining again after an earlier failed attempt at recovery. He said the breakdown below the 200-day moving average is a bearish signal, but also pointed out that such breakdowns often happen just before a market reversal.

XRP Set for Possible Rebound
According to Blockchain Backer, XRP’s current correction has followed a classic structure. Wave A was a sharp initial decline, followed by Wave B, which brought a temporary price recovery. The ongoing Wave C is targeting lower levels and appears close to ending. The analyst ientifies the $1.40 to $1.50 range as the most likely bottom for this wave.
This range is highlighted as a strong demand zone and matches up with the 0.786 Fibonacci retracement level. It also aligns with earlier support areas, which adds strength to the idea that it could serve as a reversal point. A drop into this range would represent a 23% decrease from XRP’s current market value, offering what the analyst sees as an ideal buying opportunity.
If this historical pattern plays out again, Blockchain Backer believes the token could see a strong recovery once Wave C finishes. He emphasized that traders who are prepared to act in this range might be well-positioned for potential gains in the event of a bounce.
Related Readings | Ethereum Drops Below Realized Price, Signaling Panic, Or Long-Term Buying Opportunity?