
Ripple (XRP) is moving in a neutral phase despite the strengthening bullish momentum in the crypto market. According to CoinMarketCap, the XRP price has remained stable over the last 24 hours and over the last week.
At the time of writing, the token is trading at $1.42 with a trading volume of $1.09 billion, which has declined by 3.91% over the last 24 hours. However, its market capitalization stands at $87.93 billion, which is stable.

Source: CoinMarketCap
Also Read: XRP Shows Strong Bullish Setup: 10% Breakout Ahead
XRP Structure Signals Compression Before $3 Breakout
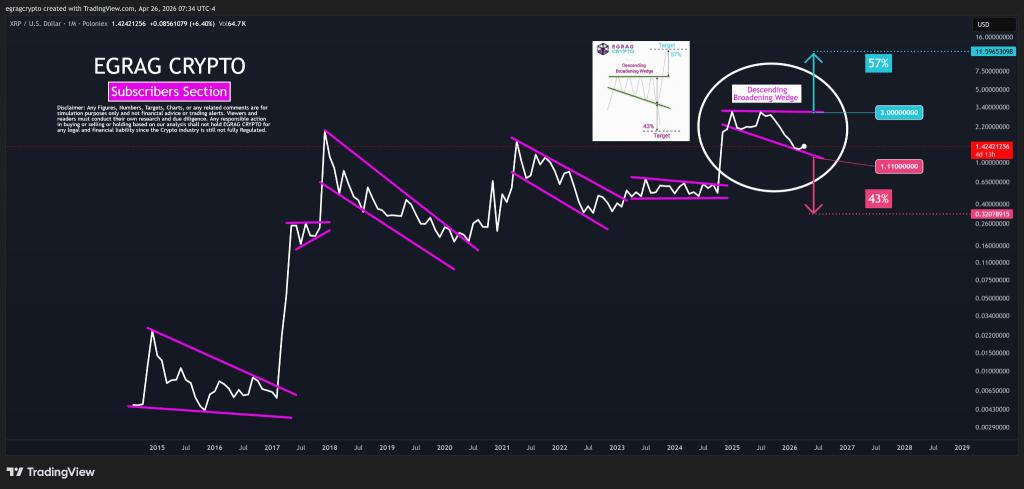
Furthermore, the crypto analyst EGRAG CRYPTO revealed that XRP traders are increasingly shifting from candlestick charts to line charts to filter out short-term volatility.
Unlike candles, line charts remove wicks and emotional price spikes, revealing a clearer macro structure. This approach helps highlight the underlying trend, making it easier to interpret real market direction without noise-driven distortions influencing decision-making.
The current XRP structure suggests a compression phase following prior expansion. Price action is forming lower highs into a defined support area, indicating tightening movement rather than chaotic distribution.
This pattern often reflects re-accumulation, where larger participants build positions gradually. The absence of breakdown behavior supports the view of controlled consolidation rather than weakness.
Source: EGRAG CRYPTO’s X Post
If the XRP price breaks above its resistance level, a move to $3.00 may be anticipated, along with expansion.
If, on the other hand, it falls below $1.10 support, there is likely to be an intensification of its liquidity sweep towards $0.90. The market structure has reached a crucial stage of development.
Technical Indicators Point to Consolidation Phase
According to TradingView, it is evident from XRP that there is an instance of consolidation after the recent drop in price.
Currently, the price is trading near $1.42, where the 20-day and 50-day EMAs lie. This indicates the presence of confusion within the market. Yet, the asset stays depressed under the bearish 100-day and 200-day EMAs.

Source: TradingView
RSI is standing around 55, indicating a cautiously optimistic outlook. As the RSI has rebounded from its oversold status in February, the indicator is currently trading above the middle point, implying a cautious resurgence of buying pressure.
Investors may be looking for a breakout above important moving averages or a breakdown below the current level.
This article contains market analysis and price predictions. These are not guarantees. Crypto markets are volatile. Always DYOR. Not financial advice.
Also Read: XRP Triangle Formation Intensifies as 10% Move Nears Breakout Zone
