- XRP shows a weakening bearish structure on lower timeframes but maintains long-term support near the $2.00 zone.
- Oversold readings and improving volume suggest seller exhaustion and possible trend recovery.
- A move above $2.40–$2.50 could reopen the path toward the $2.80–$3.00 band.
XRP’s short-term structure remains under pressure as the 12-hour chart continues to print lower highs. Digital Nomad Woman explained that price failed multiple times to break above the previous major high at 2.3042, creating a clear stretch of weakening buyer momentum.
Each attempt to push through the barrier was met with selling activity, signaling that the market lacked the strength to reclaim the level. When a resistance area is tested repeatedly and still refuses to break, the pattern usually reflects exhaustion rather than healthy demand.
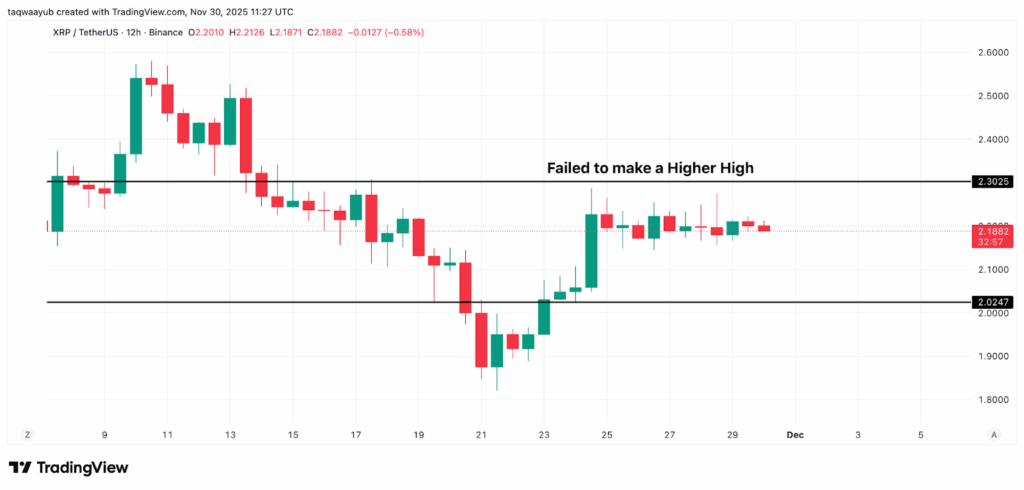
This ongoing inability to flip structure suggests the next logical moves: either a retrace toward the lower boundary of the current range or even the formation of a fresh low.
The setup follows a textbook bearish continuation pattern, where the trend remains downward until a key high is taken out with force. This framework helps traders focus on structure rather than emotion, especially during uncertain swings.
Also Read: XRP Consolidation Ahead? Market Watches $2.60 Close for Bullish Confirmation
XRP Weekly Chart Holds Firm Above the $2.00 Support
Despite the short-term pressure, XRP is currently at $2.19 on the charts for this week, up by approximately $0.14, all above the crucial $2.00 level.
This particular price area has managed to provide a solid foundation for quite a few instances of a possible fall, even amid situations of considerable sales. The $1.90-$2.00 area continues to be backed by buyers, whereas the $2.60-$2.80 area caps them.
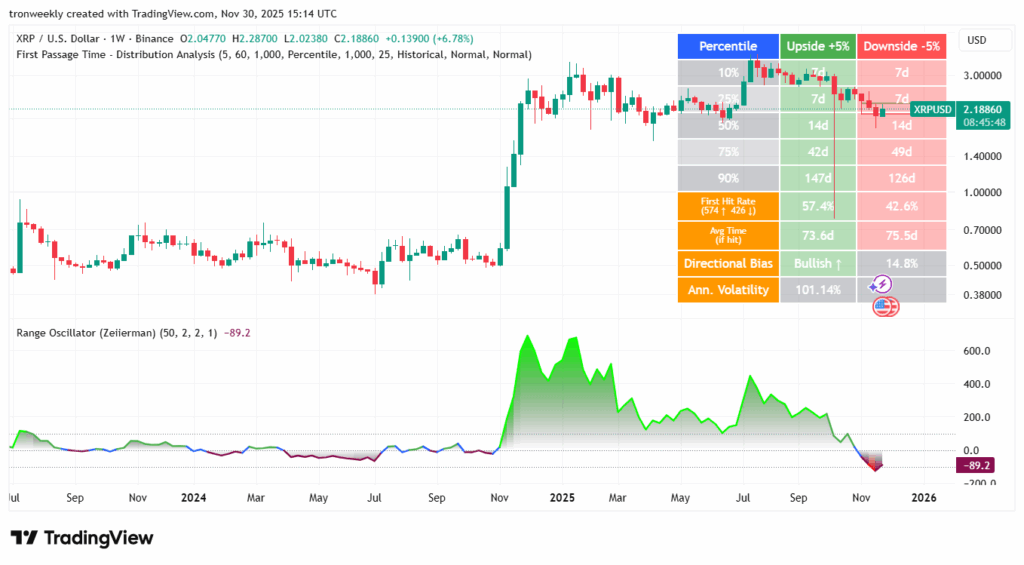
Market statistics indicate a 55.5% probability of XRP moving up first, a 44.5% probability of moving down, and hence a lean towards a positive trend. The trend remains positive for the long term if the mid-range profile is maintained.
Then, there is the Range Oscillator at –87.3. It is a strong indication that XRP is heavily oversold. It is a known fact that a value of 60 is a strong sign to revert, since a value lower than 60 shows a sign of exhaustion.
Volume Patterns Signal Accumulation and Reduced Volatility
Also, volume activity offers a supportive background. The LuxAlgo Volume Surprise tool plots about $40.62 million of abnormal buying after a period of low participation.
Although there is still some selling pressure, these red columns are significantly smaller than they appeared a couple of months ago.
The relatively constant overall volume and averaging process indicate that the market is transitioning from a distribution phase to a possible accumulation phase.
Volatility for the year is high at 101%, typical for XRP prior to a strong movement. It appears, as the candles trend closer on a weekly basis and a quieter environment is reached, that the market is preparing for what’s to come.
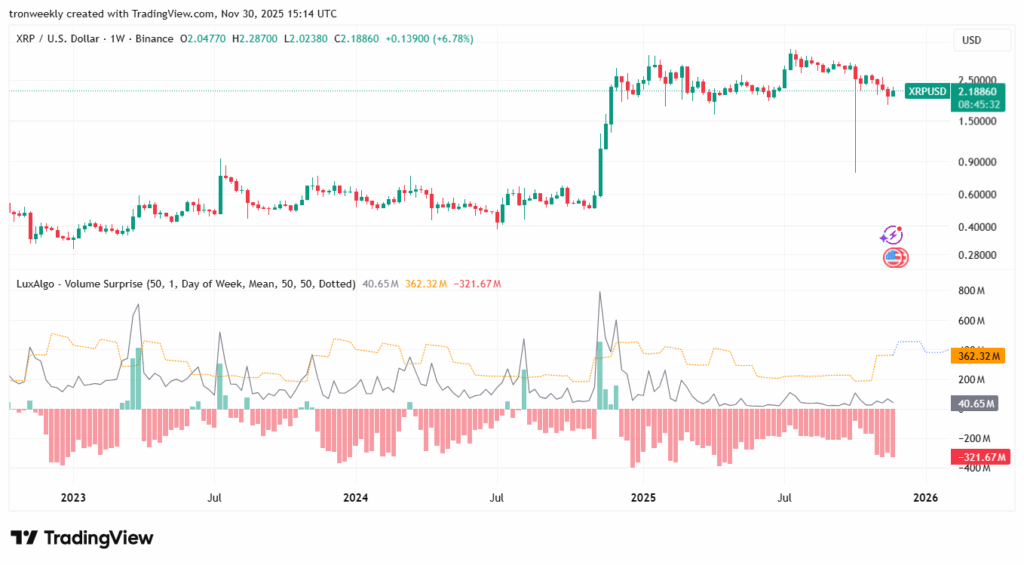
It is vital to remain above $1.90-$2.00, and breaking above $2.40-$2.50 could lead to a price of $2.80-$3.00.
Also Read: XRP Signals Weekly Bullish Growth While Holding Key Support: Could 2026 Start With a Breakout?