- ZEC finds strong support between $190 and $205, a key historical demand zone attracting buyer interest.
- MACD remains bullish, with strong upward momentum but potential slowdown as buying pressure cools.
- Analysts forecast potential ZEC recovery toward the $300–$400 range if support holds.
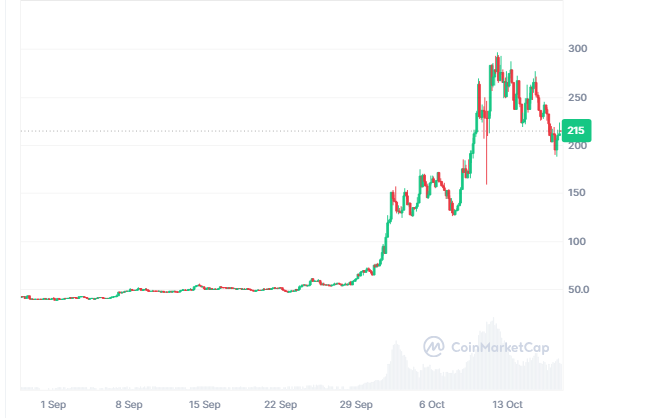
Zcash (ZEC) has entered a steep downward trajectory, signaling a significant loss of momentum and waning investor interest. Over the past 24 hours, the token has shown stability, but weekly performance shows a staggering 9.45% drop in value.
At the time of writing, ZEC trades at $215.54, with a 24-hour trading volume of $660.59 million, a decline of about 13.32% from the previous day. The token’s market capitalization currently stands at $3.47 billion, reflecting the broader market’s bearish sentiment.
Source: CoinMarketCap
Also Read: Czech Republic Bold Crypto Reforms on ‘Zero Capital Gains Tax’
Zcash (ZEC) Finds Strong Support: Is $400 Next?
According to crypto analyst KNIGHT, the price chart shows the ZEC perpetual swap on a 4-hour timeframe. The price recently dropped sharply from highs near $280 and found strong support between $190 and $205. This highlighted green zone has consistently acted as a reliable demand area, where buyers have historically stepped in to absorb selling pressure and initiate rebounds.

Source: X
The red projected line outlines a potential bullish path for the coming sessions. It suggests a gradual, staircase-like recovery before accelerating upward toward the $300–$400 range. If the price manages to hold above this crucial zone, it may establish a solid base for a sustained uptrend and signal renewed market confidence in the asset.
RSI Indicates Overbought and Cooling Momentum
Zcash’s RSI (Relative Strength Index) stands at 76.79 and keeps it firmly in the overbought region above the level of 70. This means that buying momentum has been very high due to recent increases in prices. This kind of high RSI level, however, usually comes before short-term corrections or even price consolidations since profit-taking begins and momentum begins to ease after a very long bearish breakout.

Source: TradingView
The MACD line at 21.00 stays up at the signal line at 13.36, reinforcing strong bull pressure. The expanding bull histogram confirms ongoing upward pressure and concludes that the upmove remains in place. However, with RSI registering overbought, the strength of the MACD could begin to flatten or dip if buying interest tapers off.
Also Read: Czech Republic Exempts Bitcoin from Capital Gains Tax After 3 Years