Ondo Finance price (ONDO) gained more traction in the cryptocurrency markets due to increased buying pressure and heightened interest in real asset projects, which helped boost the coin’s price. The ONDO made impressive gains on a daily basis, as the number of investors in the market indicated a positive sentiment for the bull run.
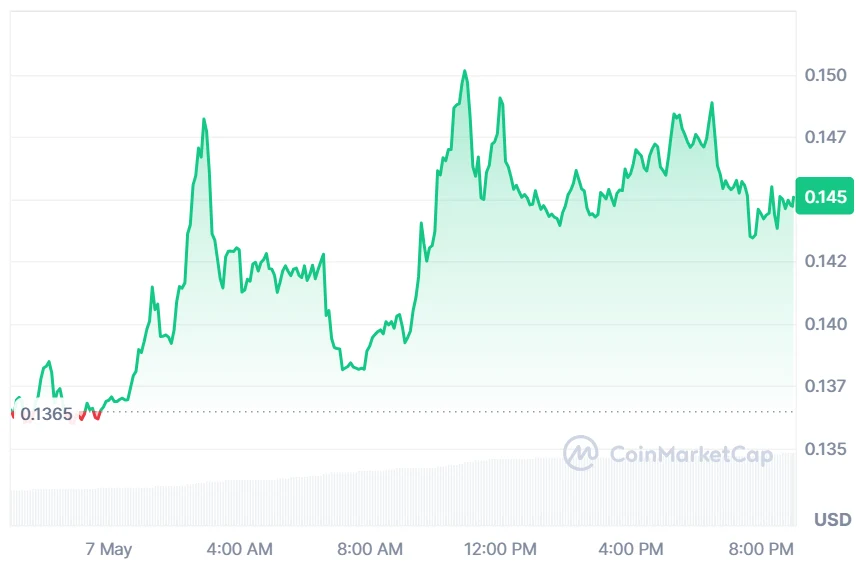
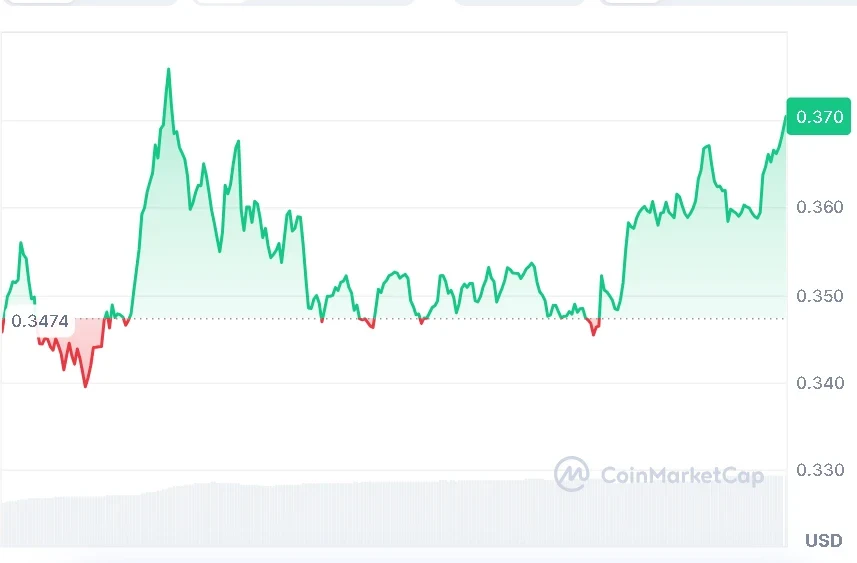
At the time of writing, ONDO is trading at $0.3704 with a daily trading volume of $574.90 million and a market capitalization of $1.77 billion. The token gained 5.03% during the last 24 hours, according to CoinMarketCap.
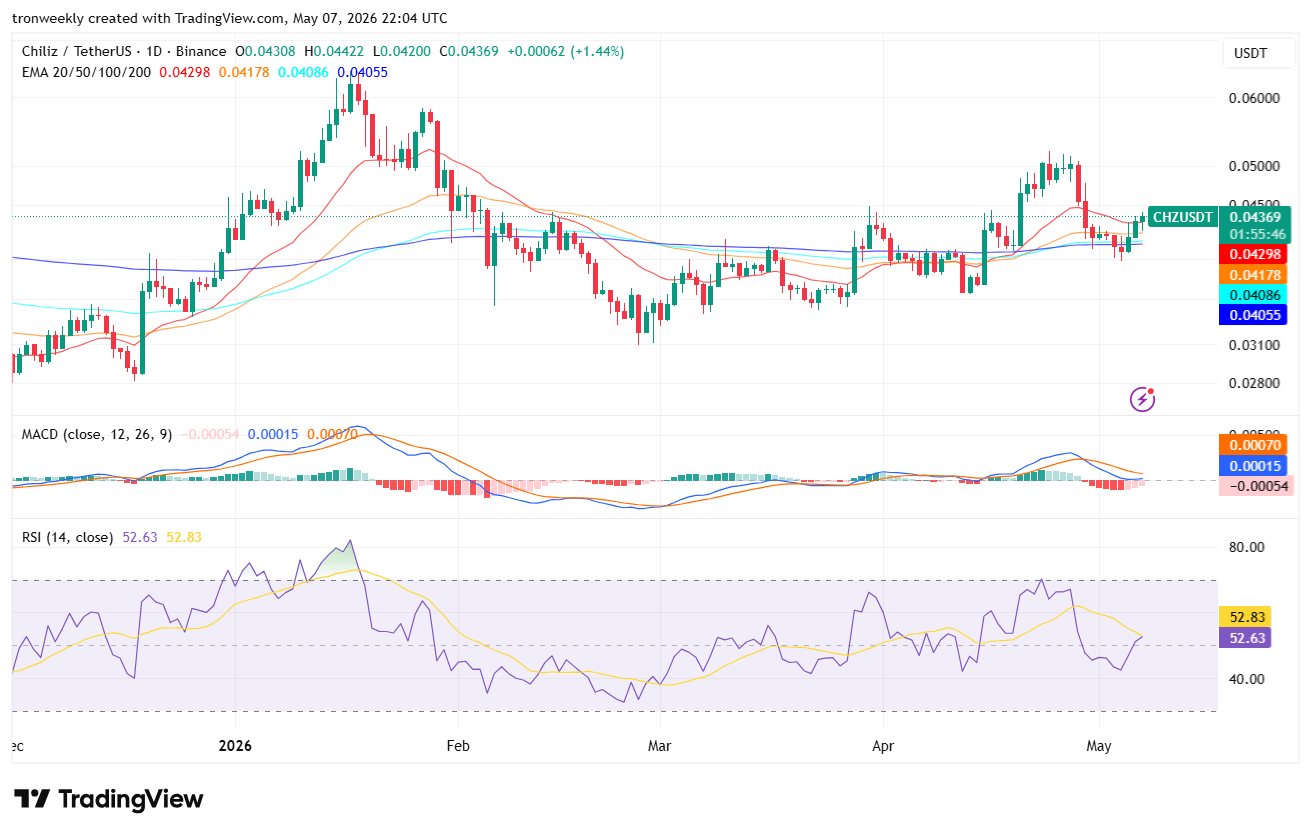
Also Read | Chiliz Price Prediction: CHZ Signals Possible 2,700% Rally
Ondo Finance Price Signals Strong Bullish Setup
Crypto analyst Crypto Patel made an assessment on the ONDO configuration on May 8, 2026, indicating that the current configuration was the best opportunity in the market. The Ondo Finance Price had already achieved significant profits based on its past entry points and was still exhibiting strong recovery strength after bouncing off the critical $0.20 support level.
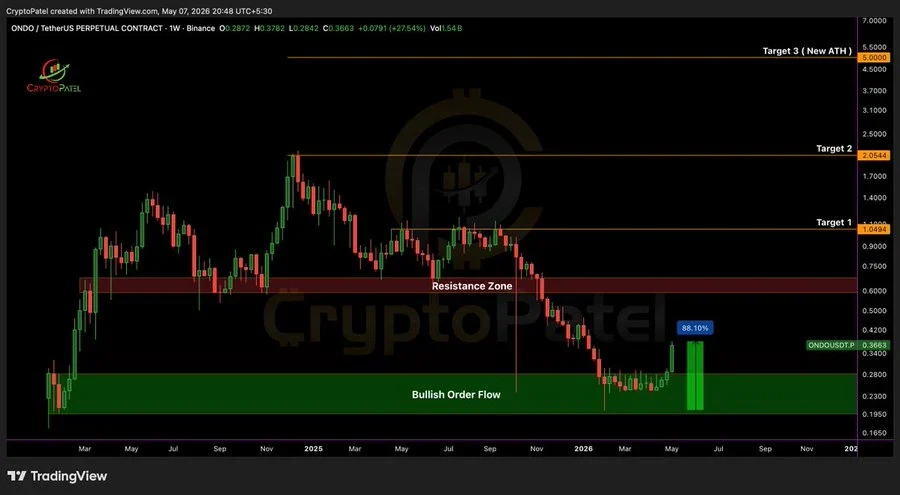
Crypto Patel further noted that the rising story around RWA is contributing to the positive outlook on the market. With increasing interest in tokenized real-world assets, the Ondo Finance Price may continue to attract buyers seeking to invest in the rapidly developing crypto industry.
The market participants have currently placed their eyes on the crucial resistance area of $0.60 to $0.65 that might decide the future path of ONDO.
ONDO Shows Strong Volume Growth
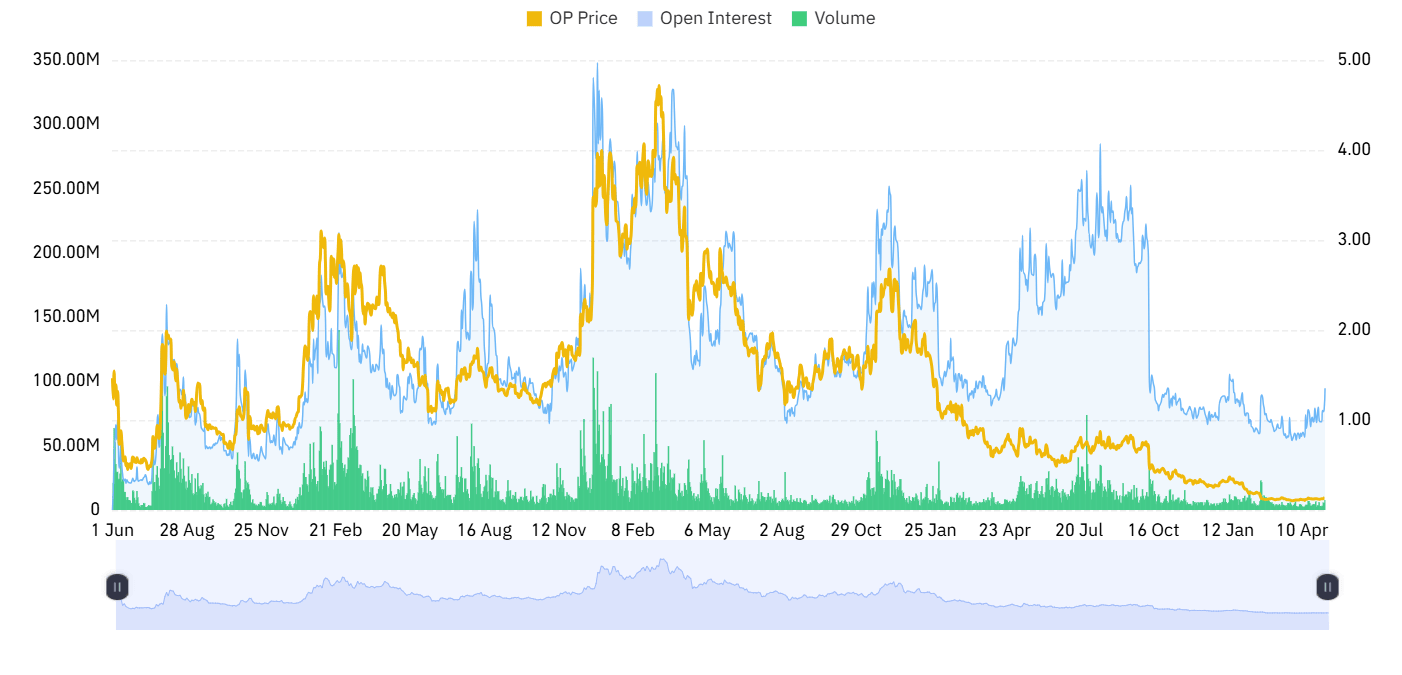
Moreover, trading activity on ONDO grew significantly during the last 24 hours. Volume grew by 39.06%, reaching $539.81 million, as market participants became more involved due to increased market volatility and momentum. This shows that many investors are keeping an eye on this cryptocurrency due to its positive price performance.

Nonetheless, the derivatives statistics indicated a somewhat cautious stance in the midst of increased activities. There was a decline of 0.41% in open interest to $163.94 million.
Meanwhile, the OI-weighted funding rate remained below zero at -0.0029%. This is an indication that some players in the market remain undecided regarding the immediate trend despite ONDO’s upward move.

Also Read | JASMY Price Eyes Breakout: Falling Wedge Could Trigger $0.02 Rally