- Altlayer nears $0.045 as derivatives volume skyrockets over 500 percent.
- Bullish RSI and MACD patterns suggest strong upward momentum for ALT.
- Rising spot and futures volume signals breakout potential for Altlayer token.
Altlayer (ALT) is rapidly approaching the key resistance level of $0.045. This happens after a 530% spike in derivatives volume. In addition, bullish technical indicators signal a potential breakout as momentum builds across both spot and futures markets.
Altlayer Breaks Above Key VWAP and Fib Levels
As the current price on the chart by TradingView shows, ALT price has posted a 3.96% growth over the last 24 hours. It now has a value of $0.03962. This rise is accompanied by the token surging through important VWAPs and Fibonacci levels.
On the 4-hour chart, ALT has surged beyond the 0.786 Fibonacci retracement, which corresponds to $0.03844. It has already reached $0.045 territory. This level served as a very high resistance level last month.
Trading volume on the spot market has also jumped, with 4.88 million ALT traded during the latest session. The volume spike matches the bullish breakout structure seen on the chart.
Price action shows a strong upward push after consolidating around $0.035 for several days. This shows a chance for a breakout if momentum continues.
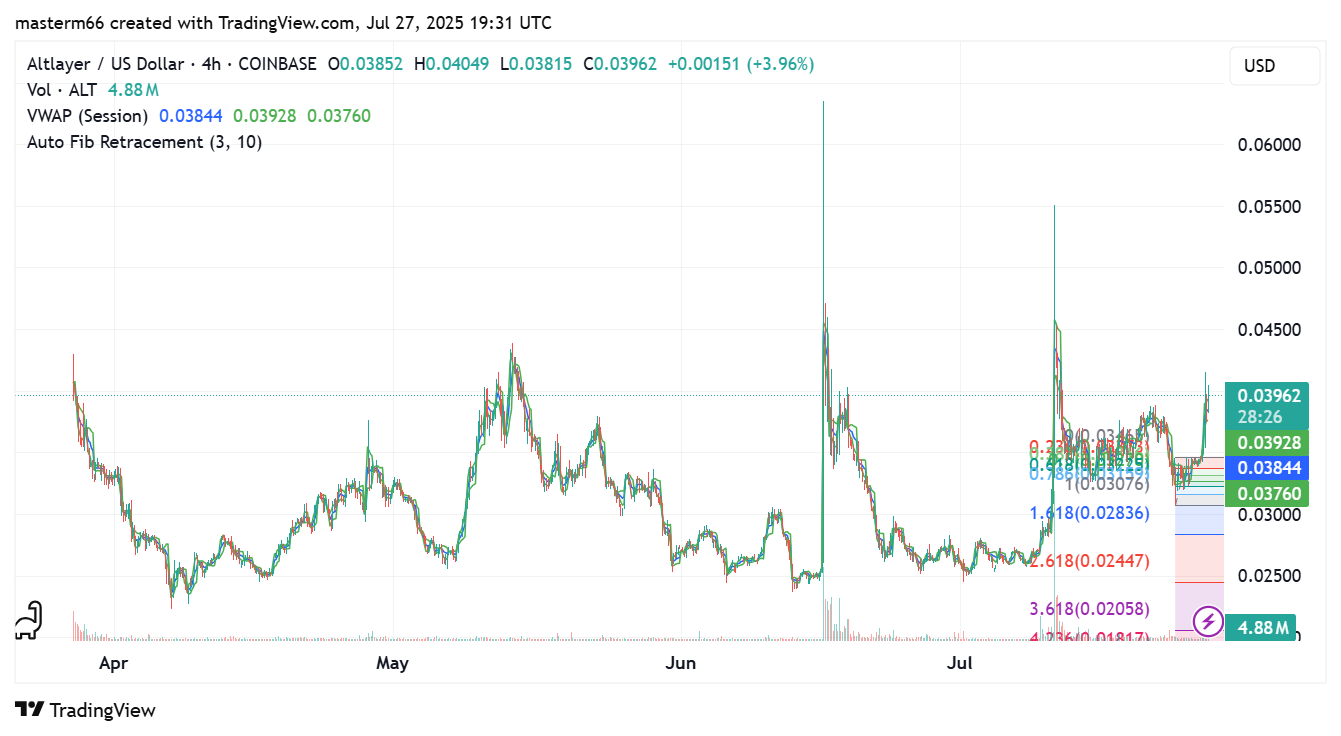
Fib. and VAWP. Source: TradingView
Also Read | SPX6900 Price Surges to $2.04 – Is a 30% Rally to $2.6 Next?
RSI and MACD Are Showing Bullish Signs
Altlayer is showing an RSI reading above 72.42, placing it in an overbought position. A reading that exceeds 70 is usually an indication that the asset is performing very well.
But it could be confronted with resistance. Provided that the buying pressure remains, price may further rise even though it is at overbought levels.
Nevertheless, profits may be taken by traders if the price gets stuck at a value below $0.045. The bullish mood is also supported by the MACD indicator. The MACD line has noted a crossing above signal line and continues to stay in the positive region.
This crossover indicates the swing of momentum that benefits the bulls. There is also growing strength demonstrated in the histogram that adds to the positive trend.
In the past, ALT has traded in the $0.045 to $0.048 area. Such levels have become resistance targets in the short term. In case of a price breakthrough above these levels, the subsequent high will be at about $0.055.
An upward breakout of this level may be an expansion towards the earlier high of around $0.06. On the negative side, the support level is at the 1.0 Fib of $0.03760. There is more support at $0.035 and the 1.618 extension of $0.02836.
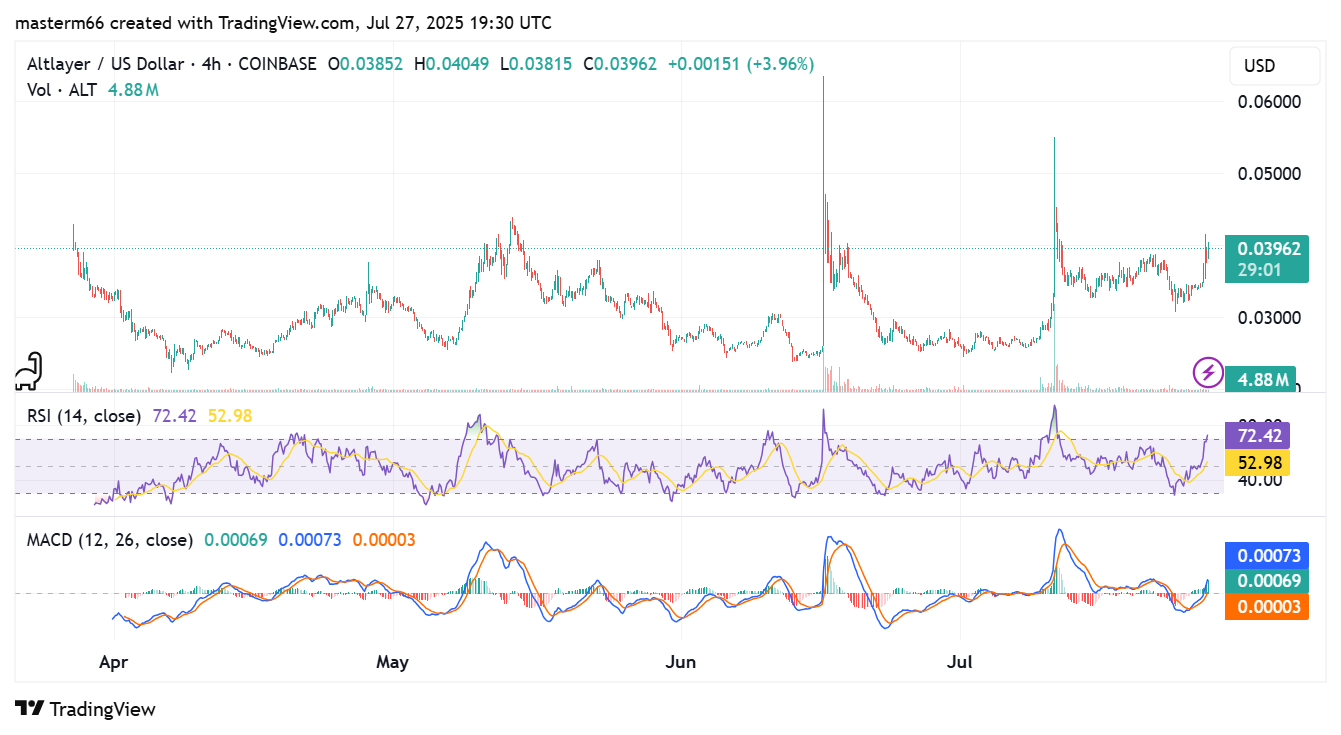
RSI and MACD. Source: TradingView
Altlayer Derivatives Surge Indicates Break Potential
The derivatives volume for ALT increased by 529.76% to $170.27 million. There was also an upswing in open interest at 49.98%, which amounted to $29.91 million.
The recent sharp increase in the number of trades indicates increased attention from traders to the token. This is usually followed by a strong price movement upward or downward.
Traders must be careful of any potential liquidation in case the price changes too quickly. The combined technical breakout and increasing derivatives bring bullish certainty.
It is advisable to be cautious due to the high RSI and possible resistance at the level of $0.045. Movement of price beyond this level may be confirmation that the breakout pattern continues.
Altlayer’s market behavior was very erratic with obvious fluctuations and corrections since April. However, the last formation displays a lower low and an upward sharp candle, which creates a change in trend. Short-term traders will get additional benefits in case this trend persists.
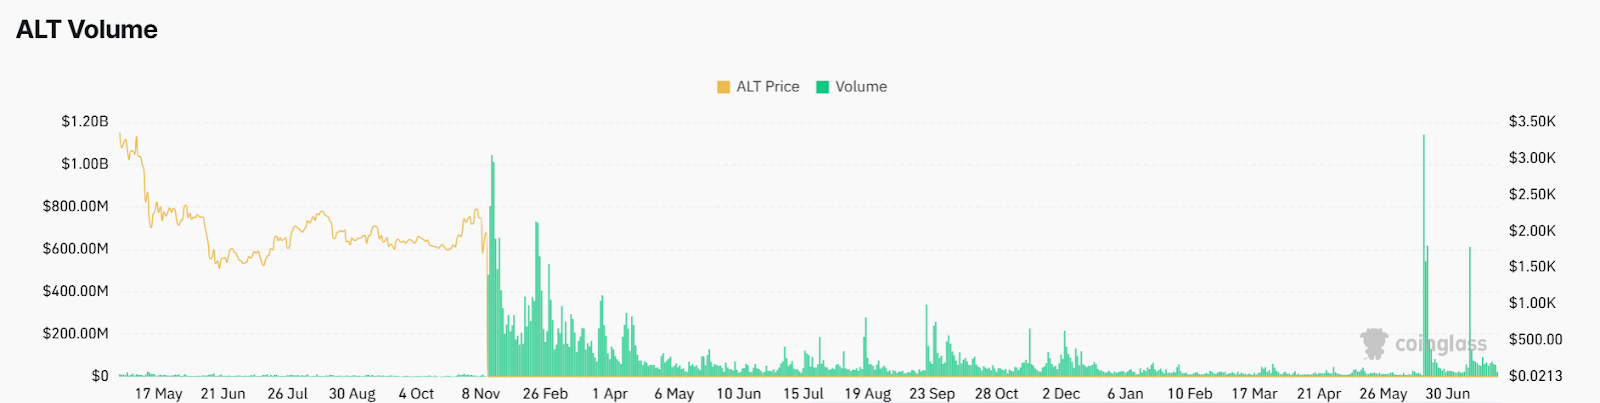
Source: Coinglass
Currently, ALT is leading many other mid-cap altcoins in the aspect of derivatives growth. The following 48 hours will define whether the $0.045 target will be upheld or invalidated.
ALT still looks good both technically and in the derivatives markets. It is the price that is now nearing a big decision point. This is being keenly watched by traders to see whether it will get rejected by a significant resistance level.
Also Read | Cronos (CRO) Price Gains Momentum: Is $0.23 Resistance the Next Target?