
Bitcoin price gained support after a cooler-than-expected CPI report gave crypto traders more confidence that the Fed will avoid tightening policy further.
Bitcoin (BTC) has the largest market cap of any cryptocurrency and is one of the best indicators of risk appetite across financial markets.
Price movement of BTC tends to follow changes in inflation readings and perceptions of future Fed actions. At press time, the BTC price was trading at approximately $62,204, up 1.92% over the past 24 hours.
What Is the Market Reacting to in the Latest CPI Report?
There was a slight surprise for market participants with the latest CPI report. The bigger surprise was expected to occur with the release of the Core CPI based on the prior month’s data but was in fact also lower than anticipated.
The Core CPI (without Food and Energy), which were both excluded in the report released today, increased 0.2% for the month when economist’s consensus was for a 0.3% increase.
Based on this information, it appears that there are less upward inflationary pressures than expected which lowers the likelihood that the Fed will need to pursue a more aggressive interest rate policy.
For the BTC price, the lower CPI printing provided sufficient support for BTC price traders as they evaluated the Fed’s next steps regarding monetary policy.
Also Read: Bitcoin Quantum Safety Under Spotlight as Draper Compares Banks vs Blockchain Security
Fed Pause Expectations Are Supporting Bitcoin Price Sentiment
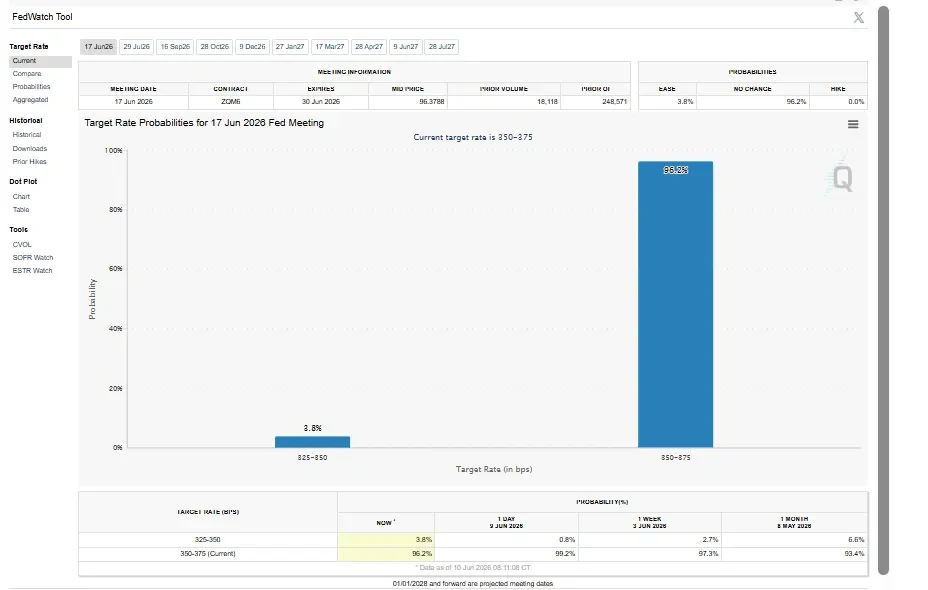
The sentiment for the Bitcoin price movement has been bolstered by the Fed’s expected interest rate pause. Following the recent inflation report, market confidence in a Fed pause has grown considerably, according to CME FedWatch data, which shows that traders are now pricing in a 96.2% chance of no Federal Reserve interest rate changes at their June 17 meeting, with the existing target rate ranging from 350 to 375 bps.
In addition, there is only a 3.8% chance of any rate increases occurring during that timeframe. As expectations of a Fed pause build, they are supporting risk sentiment and BTC price movement as a result.
What Bitcoin Price Charts Are Telling Traders
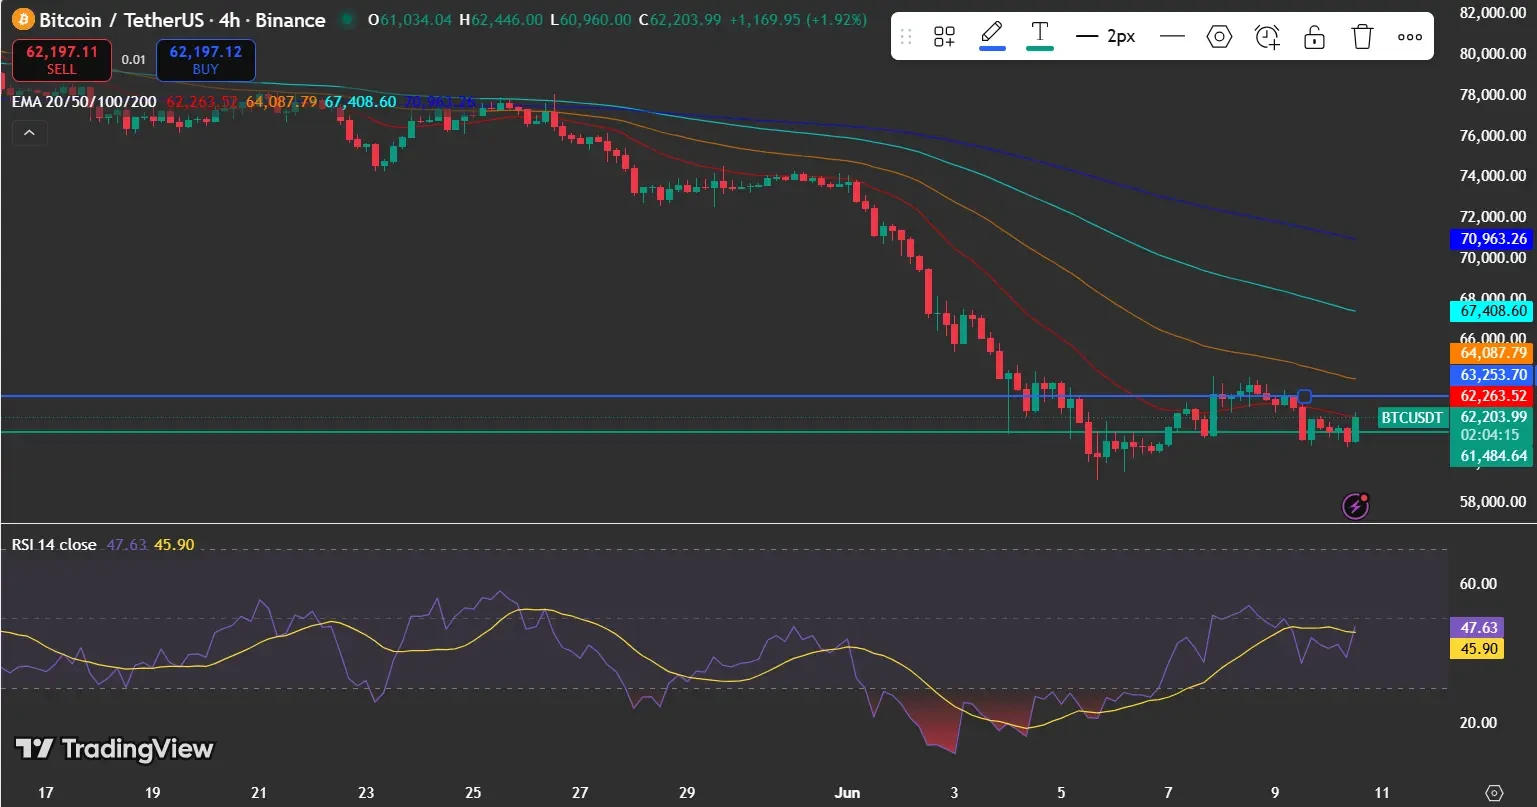
Despite the positive macroeconomic environment, Bitcoin price currently trades well below its higher moving averages (e.g., 20 EMA at $62,263 represents the first area of immediate resistance, and the 50 EMA at about $64,088 represents another area of considerable challenge).
The Relative Strength Index (RSI) is at approximately 48 (indicating neutral momentum) indicating that the market has not reached a strong enough position yet to secure decisive bullish momentum.
The recent inflation data has strengthened expectations for a Federal Reserve pause, that have added to the positive momentum for Bitcoin price.
However, despite this mixed technical outlook, if inflation pressures decrease and if traders’ confidence grows that rates will stay the same, they should be able to maintain their desired minimum support for BTC price above $62,000 going forward.
This article contains market analysis and price predictions. These are not guarantees. Crypto markets are volatile. Always DYOR. Not financial advice.
Also Read: BlackRock ETF Reduces Bitcoin Exposure With $61M Sale Amid Volatility