ANKR price risks a breakdown today, as Alpha Crypto Signal highlights weakening market conditions. The analyst identified declining volume and a descending triangle pattern shaping bearish price structure.
According to Alpha Crypto Signal, ANKR’s low trading activity increases susceptibility to manipulation. Low liquidity environments often trigger sharp downside moves across crypto markets.
Currently, the ANKR price is approximately $0.00518. Trading volume has decreased by more than 36% since last week, according to CoinMarketCap.

ANKR Price Analysis Displays Descending Triangle Pattern
As shown in the chart below, the ANKR price continues to consolidate inside a descending triangle pattern. Alpha Crypto Signal pointed out that lower highs are being created while a horizontal support remains intact.
This horizontal support level can be considered as the base point for determining entry points for traders. If a sell signal is generated at resistance, then a continuation move toward lower price support zones should occur.
However, if the price breaks through resistance, then all previous bearish structures become invalid. Based on Alpha Crypto Signal’s analysis, the directional guidance for the ANKR price is their framework.
Alpha Crypto Signal also mentioned that low volumes reduce price stability and enhance volatility risks. Market data further support decreasing participation and poor liquidity conditions.
Also Read | AAVE Pushes Higher From Support as Resistance Targets $116.5, $132
CoinGlass Derivative Data Supports Bearish Position On ANKR Price
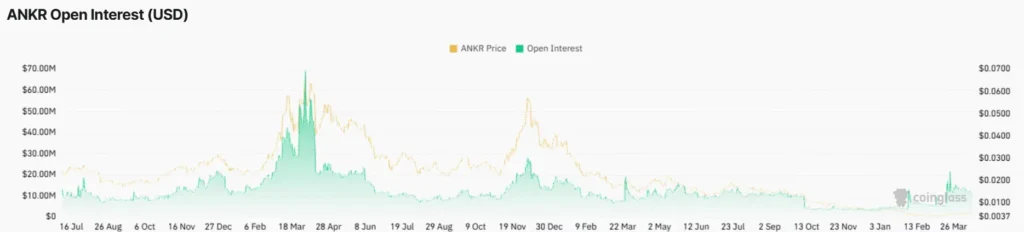
Derivatives data available from CoinGlass provides additional evidence supporting Alpha Crypto Signal’s bearish position on the ANKR price. Open interest declined slightly.
This decline indicates that less capital is being committed to the trade of futures contracts related to ANKR. Funding rates continue to remain negative. Therefore, most exchanges indicate that short positions currently prevail.
These two factors add to the probability of sustained downward pressures on the ANKR price.
Recent Liquidation Trends Show Weak Participation
Liquidation data has remained low compared to historical averages. This trend is consistent with Alpha Crypto Signal’s observations of poor participation within the markets.
Short liquidations make up the majority of recent liquidations. Therefore, they represent small upward squeezes.
Although short liquidations have made up the majority of recent data, overall participation has remained very weak. Such a weakness represents a low amount of trader confidence.

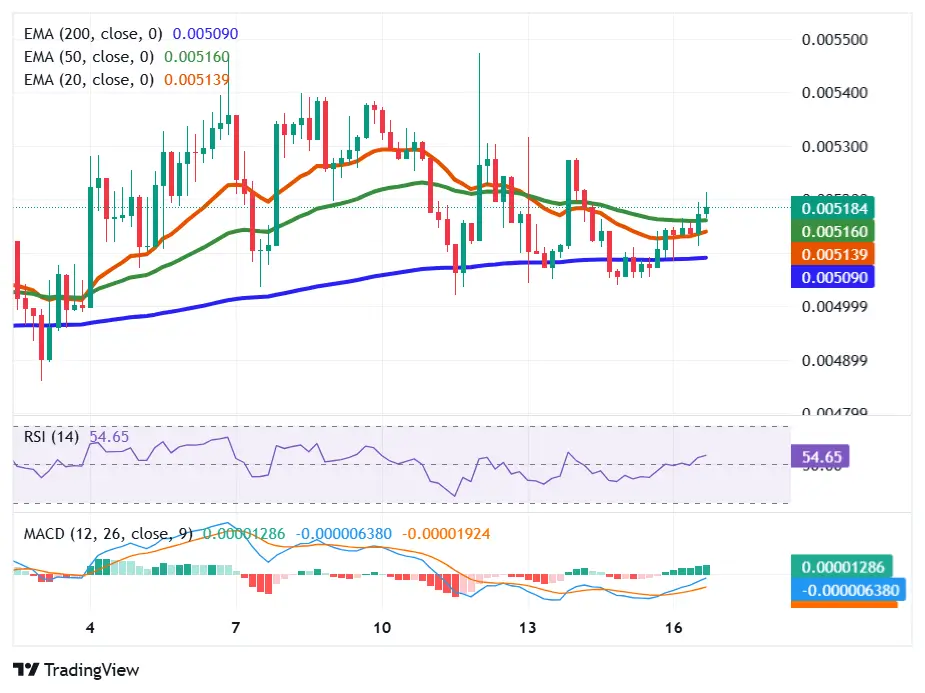
Technical indicators from the TradingView 4-hour chart suggest that the current ANKR price action reflects little strength. Current short-term EMAs are flat, suggesting a period of consolidation and not a continuation of prior trends.
RSI is located near the mid-point, indicating momentum balance. MACD is beginning to show signs of recovery, but until it is accompanied by high-volume buying, there is no confirmation of such a signal.
Key Levels For ANKR Crypto Price Prediction
According to these predictions, the ANKR cryptocurrency price may face resistance around $0.053, where the downward trendline exists. Support still exists around $0.050, which serves as the primary area of interest for potential breakdowns.
A confirmed breakdown would likely result in a rapid decline in ANKR price in areas of lower liquidity. Conversely, a successful breakout above resistance would invalidate the bearish structure and produce a significant shift in investor sentiment.
Confirmation via a massive expansion of trading volume will be necessary for validation of this ANKR crypto price prediction. Extremely low liquidity conditions significantly increase the risk of sudden and aggressive price swings.
This article contains market analysis and price predictions. These are not guarantees. Crypto markets are volatile. Always DYOR. Not financial advice.
Also Read | PEPE Price Rises as Strong Volume and Support Hold Hint at Upside Move