
ASTER price shows short-term recovery with rising buying interest, though weekly performance remains weak due to earlier selling pressure. Market activity is improving, but overall sentiment is still cautious.
Technical indicators remain bearish yet weakening, suggesting a possible momentum shift if price manages to reclaim key resistance levels ahead.
Market Activity Boosts ASTER Momentum
ASTER price continued trading with positive short-term momentum, climbing 3.44% over the past 24 hours as buying interest returned.
Despite the daily recovery, ASTER remains down 4.81% over the last seven days, reflecting broader market weakness and recent selling pressure.
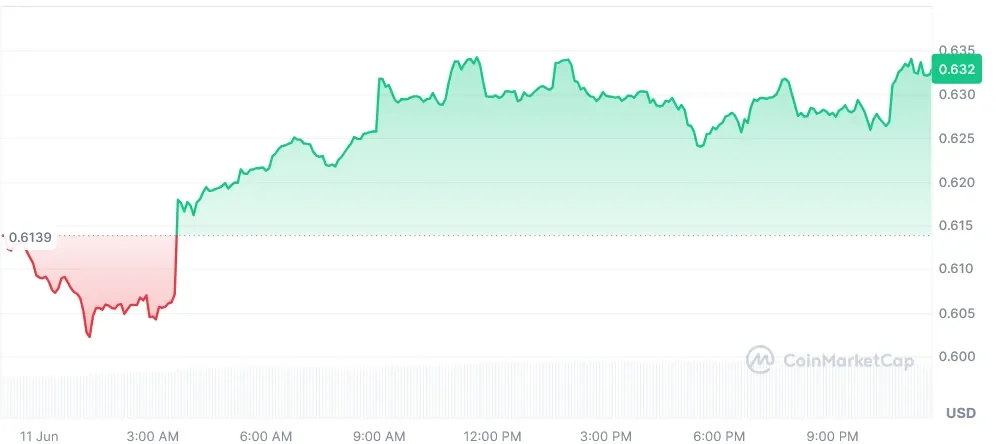
According to CoinMarketCap data, the token is trading at $0.6327, supported by growing market activity. The 24-hour trading volume stands at $113.9 million, representing a 30.29% daily increase.
Meanwhile, market capitalization is valued at $1.7 billion, marking a 3.54% increase over the same period as momentum strengthens.
Also Read: ASTER Price Analysis: Can Bullish Flag Trigger a Rally to $1?
ASTER Price Tests Key Recovery Zone
According to the crypto analyst Sjuul | AltCryptoGems, the ASTER chart shows price breaking below a long-standing consolidation range between roughly $0.64 and $0.76.
After losing support, ASTER entered a liquidity sweep zone near $0.59, where buyers quickly emerged and prevented further downside pressure from accelerating.
The recent bounce shows that the sellers have run out of energy, as the twin moves towards the old low of $0.64.

If the price manages to move past this level, the breakdown will become invalid, and an opportunity to approach the mid-level resistance of $0.70, all the way up to the range high at $0.76, will arise.
In a broader perspective, the above graph offers a positive risk/reward scenario should the bulls regain control.
Breaking out above $0.76 will open up the possibility for a move to the target range between $0.85 and $0.88, but failing below $0.59 may increase the likelihood of moving down to $0.55.
ASTER Indicators Hint At Possible Rebound
From a technical indicator, RSI (14) stands at 43.45, while its signal line comes in at 46.60. RSI below 50 shows low momentum and lack of buyers in the market.
Although RSI slightly moved above its recent lows around the 40 level, there is still a cautious tone in the market with sellers dominating.

The bearish MACD (12,26,9) continues to show readings of -0.01457 on its line, -0.00840 on the signal line, and -0.00617 on the histogram, which all indicate that selling pressure continues to dominate.
However, the declining red bars could indicate that selling is slowing down, presenting a chance for a momentum turnaround should there be a bullish crossover formation.
This article contains market analysis and price predictions. These are not guarantees. Crypto markets are volatile. Always DYOR. Not financial advice.
Also Read: ASTER Price Eyes $0.60–$0.70 Accumulation Range as Market Weakness Continues