
Avalanche (AVAX) has slipped into the $9 price zone, reflecting continued pressure across the broader cryptocurrency market. Recent technical signals indicate weakening short-term momentum, with traders closely monitoring key support levels to assess whether further downside could occur. Market data shows AVAX consolidating within a narrow band, suggesting uncertainty as buyers and sellers compete for control.
Also Read: Avalanche (AVAX) Nears $10 Breakout With Strong Momentum Build
Avalanche Holds Near $9 as Selling Pressure Builds
According to the data given by CoinMarketCap, at the time of writing, the coin is trading at $9.17 with a 2.68% decrease in price. The daily trading volume of the token is around $241.48 million, and the market cap of the coin has exceeded $3.96 billion.

The coin has lately traded near the $9 level after decreasing below several key technical indicators. Market analysis indicates that AVAX has moved under short-term moving averages, indicating sustained bearish momentum in the near term. The token has been fluctuating within a range between around $8 and $10, suggesting a span of consolidation after the latest declines.
Technical Indicators Signal Cautious Outlook
The data given by CoinCodex suggests that the token may have an average price and a maximum price of $ 8.57 and $ 9.13 in April. The token’s potential ROI for the month might be 0.49%.

Avalanche’s price chart reveals the downward momentum. It may climb toward the resistance (blue) at around $9.29. Assuming the bullish pressure strengthens, the golden cross might emerge and send the price up to test the $9.40 range.
If the reversal continues, the bears might push down the coin’s price to the support (yellow) at $9.11. In case the downside correction gains more traction, the death cross could form, and likely drive the asset’s price to a low of $9 or even lower.
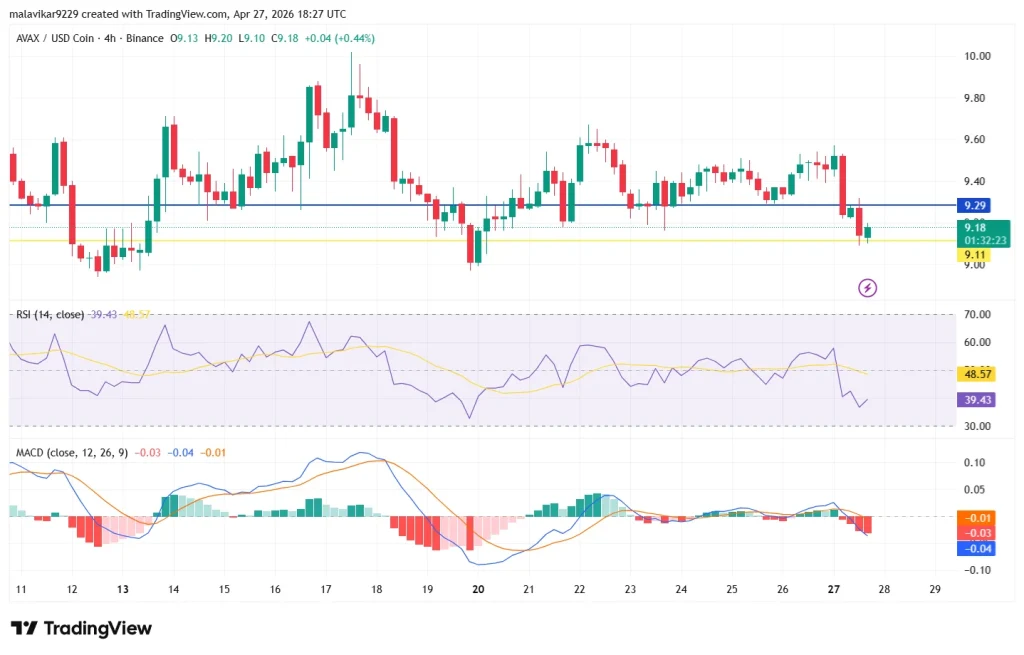
The relative strength index (RSI) shows DOGE being oversold as the RSI line is below the 50 median. The moving average convergence divergence (MACD) indicator shows the coin experiencing a bearish momentum as the MACD line (blue) is below the signal line (orange).

According to the data given by CoinCodex, the 200-day simple moving average in the long run is projected to reach $ 12.68. The 50-day simple moving average (SMA) in the short term is projected to reach $ 9.34. All these figures reflect a gradual but certain movement towards the higher ground.
This article contains market analysis and price predictions. These are not guarantees. Crypto markets are volatile. Always DYOR. Not financial advice.
Also Read: Avalanche (AVAX) Consolidates Near $9 as Accumulation Signals Rally Toward $50–$150