
Binance Coin (BNB) is trending within an upward channel and has already touched its lower level of support following a slight pullback phase. The momentum oscillators reveal a weak but developing setup, where buying pressure remains unconfirmed at this point.
At the time of writing, BNB is trading at $623.24, with a 24-hour trading volume of $1.29 billion and a total market capitalization of $83.88 billion. Over the last 24 hours, the BNB has seen a 1.36% decline, showing mild pressure across short-term price movement while still holding its broader structure.
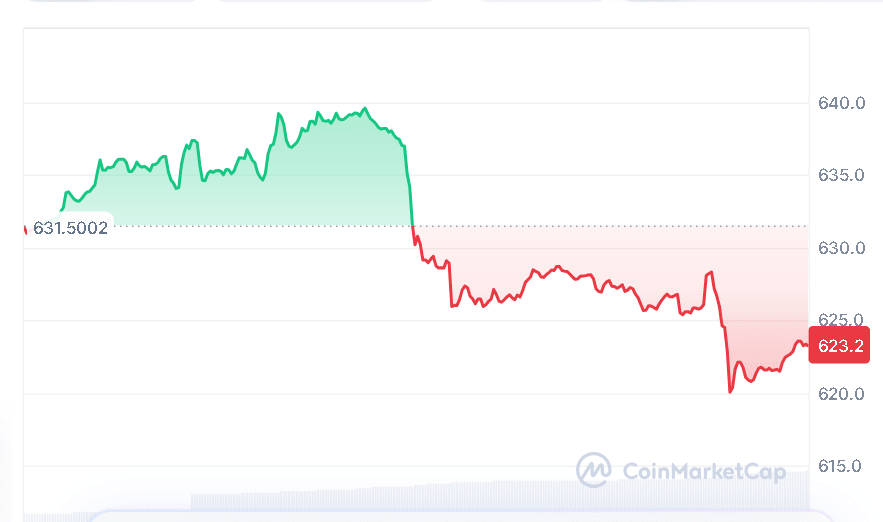
Source: CoinMarketCap
Also Read | Bitmine Ethereum Holdings Top 5M as 101K ETH Buy Signals Shift
Binance Coin Tests Channel Support Zone
As a crypto analyst, Alph Crypto Signal reported, that the BNB price is still trading within the ascending channel formation, which has been active for several weeks already. The mentioned channel formation demonstrates that there has been an uptrend over the last several weeks.
Right now, BNB is probing the lower end of this channel, an important region where the asset has found support in the past. Even though there could be a minor test below this level, experience indicates that this will most likely prove to be just a temporary deviation.

Source: Alpha Crypto Signal’s X Post
Taking into consideration such an arrangement, one of the approaches being contemplated involves entering positions slowly at the present level. When the price drops below support momentarily, it can be seen as a breakdown and not necessarily as a trend change.
First on the upside, there’s the middle line of the channel, and then the possible break towards the top line, which has been resistance during previous attempts.
Momentum Indicators Show Mixed Signals
The technicals reveal a slow and steady move to the upside without any strong upward movement. The RSI is at 48.95, which is neutral and suggests that there is no bullish momentum since it lies slightly below the signal line at 53.96.

Source: TradingView
The moving average ribbon shows that BNB is trading within the range of $622-$627, meaning that the price is close to the short-term averages. The indicator remains below the higher values of $666 and $808, indicating the trend is in a cautious phase.
The MACD indicator is showing initial signs of improvement, as the MACD line is just above the signal line, while the histogram is positive, signaling an increase in upward momentum.
BNB Holds Uptrend as Recovery Unconfirmed
Overall, BNB continues to trade within an organized uptrend structure with a slight bullish bias. It shows early signs of recovery but needs further confirmation.
A successful reversion to its channel middle line or even higher levels will confirm the optimistic view, while a break below the current support level will create uncertainty.
This article contains market analysis and price predictions. These are not guarantees. Crypto markets are volatile. Always DYOR. Not financial advice.
Also Read | AAVE Price Forecast: Can Bulls Reclaim $105 and Push Price Toward $152?