Avalanche price is encountering fresh selling pressure, even though institutional appetite for blockchain technology is drawing attention to the network’s possible role in financial services.
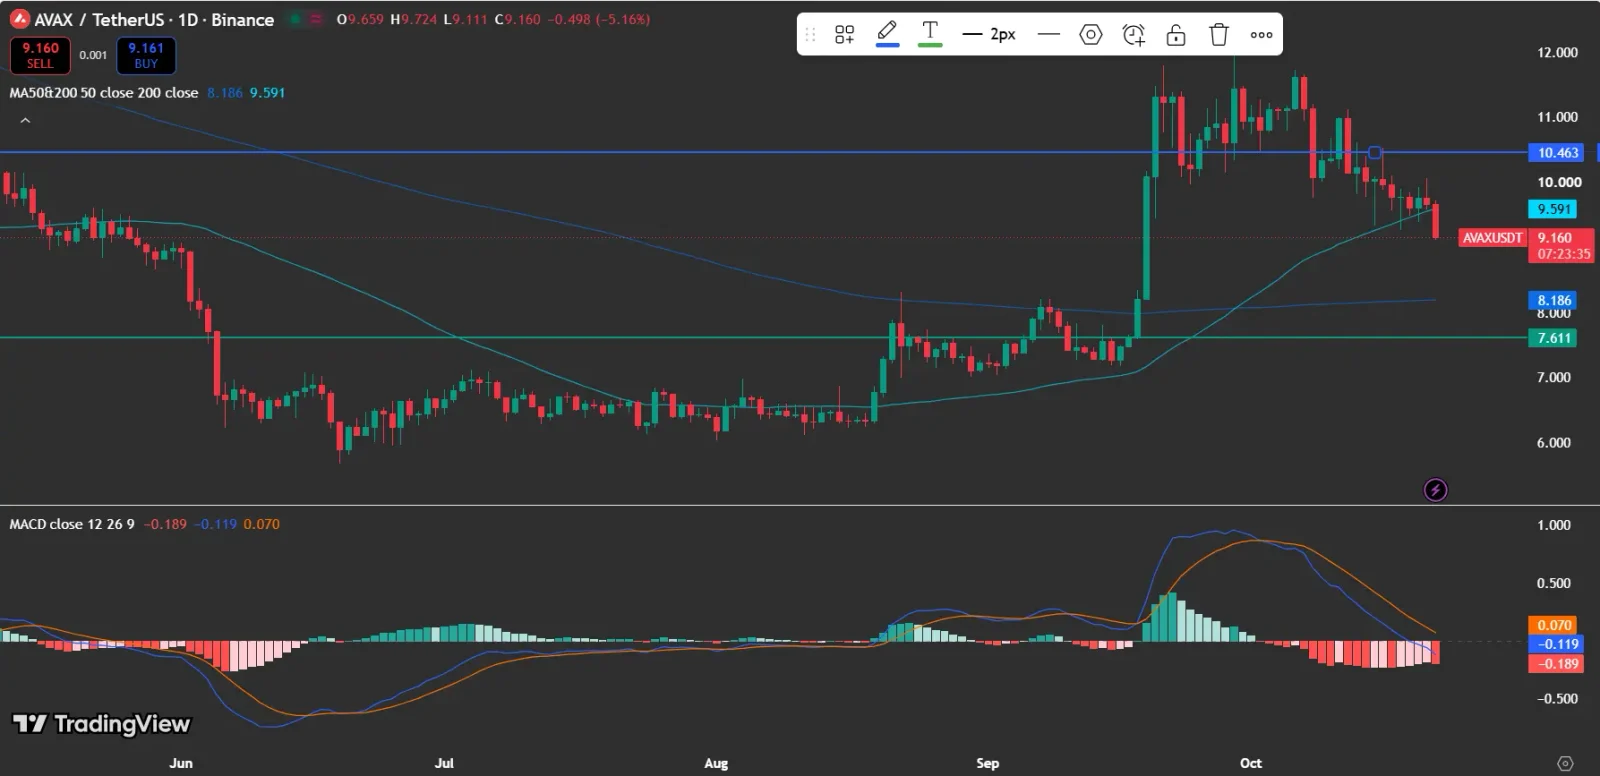
As of press time, Avalanche price is trading at $9.16, down 5.16% over the past 24 hours, based on the TradingView chart provided.
Table of Contents
This pullback coincides with Avalanche spotlighting a report indicating that 62% of banks anticipate blockchain technology becoming standard in their businesses within two years.
Also Read: Avalanche Price Stays Strong Above $10 Amid Hyundai Adoption
Why Is the Avalanche Price Under Pressure Despite Growing Adoption?
On October 22, Avalanche shared the Onchain Readiness Report findings through its official X account. Per the post, blockchain technology is already standard for 58% of payments companies, 46% of brokerages, and 42% of the fintech companies and neobanks surveyed.
These findings indicate rising interest in blockchain infrastructure throughout financial services. Avalanche states that its network is designed to support the products and services these businesses may require as financial activity shifts on-chain.
The report provides a constructive backdrop for blockchain adoption, but expectations for wider institutional use do not necessarily translate into immediate demand for AVAX tokens.
Also Read: Avalanche Price Eyes $12.23 on $2B India Agri Push
What Does the Avalanche Price Chart Reveal?
The daily TradingView chart shows AVAX trading at $9.16 following a 5.16% decline. The token has pulled back from its October highs above $11, signaling that selling pressure has grown after the sharp September rally.
AVAX now sits below its 200-day moving average of $9.59, which could act as resistance during a recovery. Its 50-day moving average is near $8.19, providing a lower reference point if the price continues falling. The chart also marks resistance near $10.46 and support around $7.61, giving traders additional levels to monitor.
How Does the MACD Influence the Avalanche Price Outlook?
The Moving Average Convergence Divergence (MACD) indicator signals that momentum is fading. The MACD line sits at -0.119, beneath the signal line of 0.070, and the histogram stands at -0.189.
Such a bearish setup implies that sellers hold the advantage at present. A shift toward a bullish MACD crossover might signal strengthening momentum, yet current readings have not confirmed any recovery so far. The negative histogram reinforces the bearish momentum signal, although a change in the indicator alone would not guarantee a price reversal.
Also Read: Avalanche Price Sets Sights on $12 Following a $245.5M Jump in Tokenized Stocks
Can Avalanche Price Recover Above $10?
The first key level to watch is the 200-day moving average near $9.59. A move back above this level could help AVAX approach $10, with resistance near $10.46 representing another hurdle for buyers.
For a stronger recovery, buyers would need to clear these resistance levels while improving momentum backs the advance. The institutional adoption report offers a constructive longer-term narrative, yet it does not ensure an immediate price rebound.
Where Could the Avalanche Price Fall Next?
On the downside, the chart identifies support around $7.61. Should AVAX stay under pressure and selling pick up, this level may become significant.
A break below support would weaken the chart’s support structure and leave the token exposed to further losses, though the provided chart does not establish a lower target.
CoinGlass data also indicate that Avalanche’s open interest has fallen from its early-October peak above $600 million to roughly $500 million by October 21. This decline indicates that the total value of outstanding derivatives positions has decreased.
\ Open interest alone, though, cannot establish whether traders are predominantly bullish or bearish, or whether the decline reflects position closures rather than new short positions.
Also Read: Avalanche Price Gains Momentum Near $11.40 as Volume Surges
What Should Traders Watch Next for Avalanche Price?
AVAX faces a mixed outlook. The report highlighted by Avalanche points to possible long-term opportunities as financial institutions explore blockchain technology, while the daily chart reveals near-term weakness.
Traders can watch whether AVAX moves back above $9.59 and then challenges $10.46, or instead falls toward the $7.61 support level. A rebound in momentum together with a break above resistance would reinforce the bullish case, while continued selling could deepen the pullback.
The cryptocurrency market remains highly volatile. Traders should monitor price movements, market sentiment, and upcoming catalysts before making investment decisions.
Also Read: Avalanche Price Holds $7.43 Support as Michigan Partnership Expands Adoption
This article contains market analysis and price predictions. These are not guarantees. Crypto markets are volatile. Always DYOR. Not financial advice.