
Bitcoin suffered one of its sharpest declines in recent weeks on June 25, falling from above $61,000 to nearly $58,000 within a single hour as heavy selling swept through the market. There was a fear that this sudden drop could compromise the vital support levels of Bitcoin.
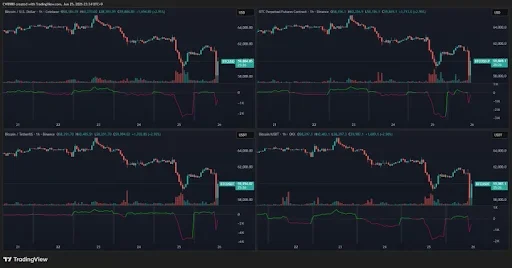
As per the data by Coinglass, in the past 24 hours, the total number of liquidations has gone up to $1.265 billion, with 209,000 users being impacted by these liquidations. During the most volatile hour, liquidations have exceeded $430 million.

Source: Coinglass
Also Read: Tokenized Stock Holders Triple Since January as Record $2.2 Billion Volume Hits
Bitcoin Sell-Off Hits Spot and Futures Markets
It was not limited to a single area, since market indicators confirmed that there were sales taking place simultaneously on Binance BTC/USD, BTC/USDT, BTC/FDUSD, and perpetual futures.
A quick correction was made after the downward movement, but then Bitcoin failed to continue and fell to the level of $59,000. A market expert noted that there was increased buying following the fall.
However, the analyst noted that it was possible that the retail investors had shifted their coins into the hands of better players due to the large number of institutions that had purchased all the coins sold out of panic. Short positions continued to increase.
Source: X
Bearishness was depicted by the order flow statistics. The CVD statistic, which is used to measure the aggressiveness of buying and selling activities, moved extremely negatively as the prices fell. This indicates that there were more sell orders compared to buy orders in the market.
There was some bounce in the Bitcoin price following the initial fall, but there wasn’t much improvement in the value of the CVD either.
This clearly pointed out that the bounce was mostly short covering rather than genuine buying pressure. With further selling, the indicator moved down.
ETF Outflows Add to Market Pressure
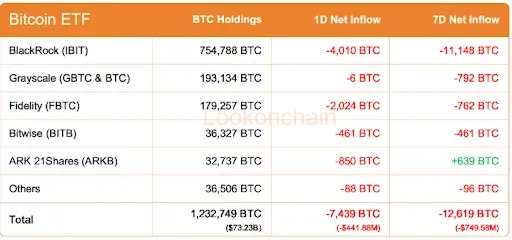
Other factors pulling down Bitcoin are funds that continue flowing out of Bitcoin ETFs in the spot category. Data from recent times reveal that the net flow for one day was negative 7,439 BTC valued at approximately $441.88 million.
Source: X
For the past seven days, the net flow amounted to -12,619 BTC valued at about $749.58 million. These outflows take away an important driver of demand, which has kept Bitcoin stable in its earlier rally phases.
Bitcoin Long-Term Support Zone Faces Critical Test
As Analyst Rekt Capital observed, at present, the situation looks quite similar to the 2022 correction scenario. In the monthly chart, the price of BTC went below the short-term trend line and also approached the longer-term moving average around the $60,000 level.

Source: X
This has been one of the significant areas of support in the market. However, if BTC manages to remain above this support level, there could be a relief rally in the month of July. If it falls below this longer-term support level, the risks of a correction increase.
This article contains market analysis and price predictions. These are not guarantees. Crypto markets are volatile. Always DYOR. Not financial advice.
Also Read: SEI Price Prediction: Can Bullish Momentum Drive a $0.13767 Move?