
- Bitcoin trades at $117,505 with a 0.69% gain as volume jumps 18.92% to $73.52 billion near resistance.
- The RSI at 47.90 reflects neutral sentiment, while the MACD shows a weakening trend with a histogram reading of a negative 34.87.
- A breakout above $112,000 confirms the price discovery phase, with Fibonacci targets at $121,000, $128,000, and $136,000.
At the time of writing, Bitcoin is trading at $117,505 with a 0.69% increase over the previous 24 hours. The daily trading volume rose by 18.92% to $73.52 billion. The weekly performance is also modest with a gain of 0.46%. Although the direction is clear, the price action is hesitating at the resistance level. Market indicators show cautious optimism among traders.
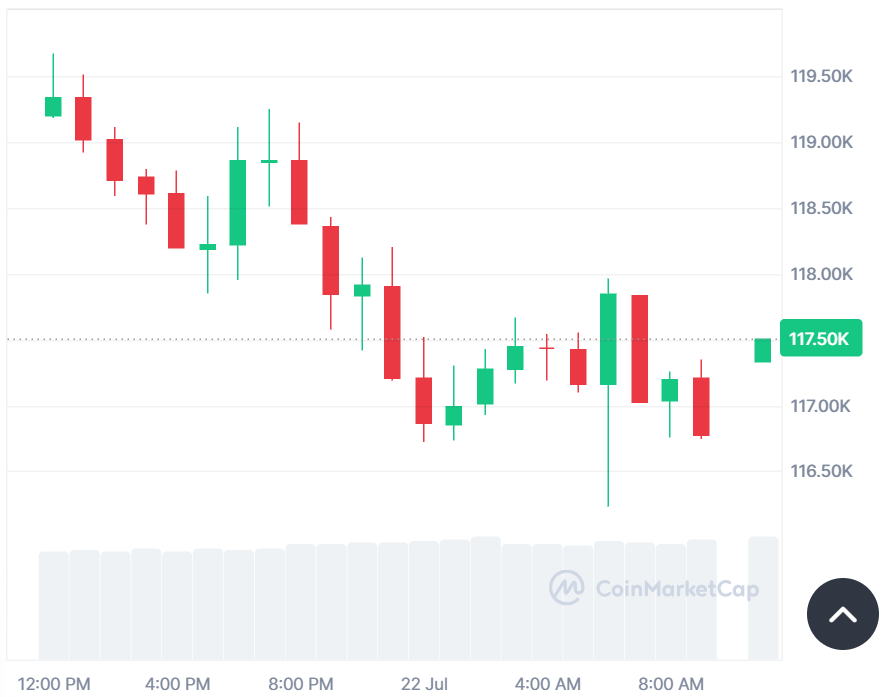
Source: CoinMarketCap
CoinCodeCap Trading highlighted that Bitcoin has risen above the mark of $112,000. This validated a channel breakout in a sideways direction and started a price discovery period. New Fibonacci targets are at a price of $121,000, $128,000, and $136,000. Support levels are located at $100,000 and $90,000. The resistance point is recorded at $120,000 and $150,000.
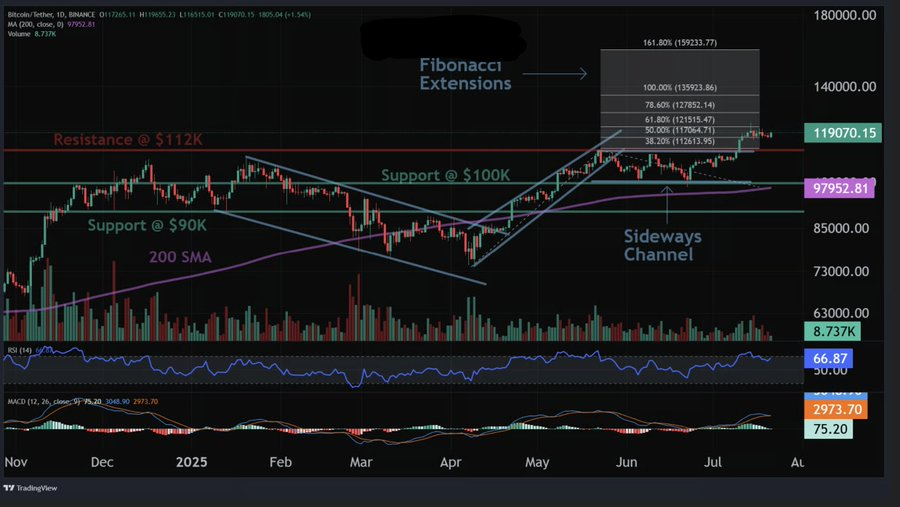
Source: X
Also Read: Bitcoin Jumps 10% After 8-Month Slump: Is This the Real Breakout?
Technical Indicators Weakening
The Relative Strength Index (RSI) is at 47.90 in the hourly chart. This puts Bitcoin in a neutral position. An RSI under 50 revealed that the market has no strong momentum. Traders have not been convinced decisively in either direction. A break above 50 may swing the odds back to buyers. Until that point, there will be lateral price movements.
MACD indicates the fading momentum. The MACD line stands at -280.33 and the signal line stands at -245.46. The histogram indicates a negative value of -34.87. These figures suggest a decline in bullish momentum. If buyers do not gain traction, the trend might be paused. Should the pressure persist, it may be a bearish crossover.
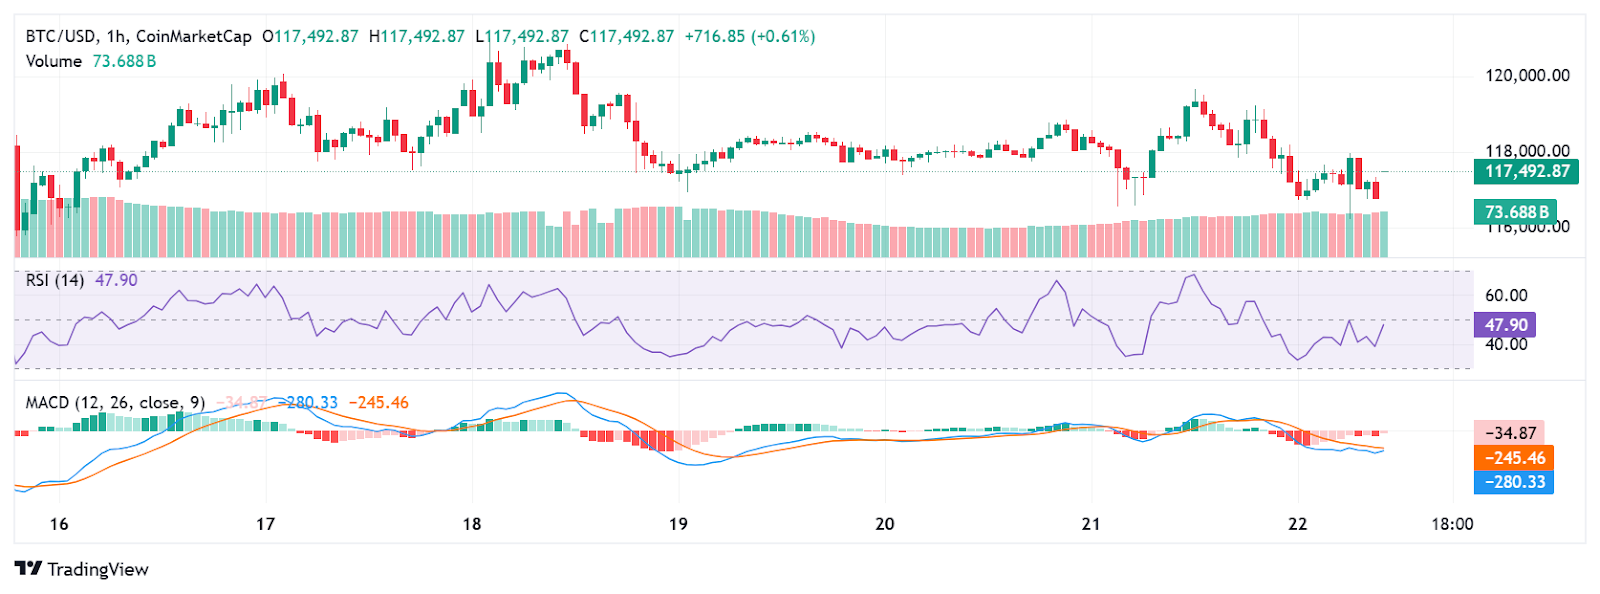
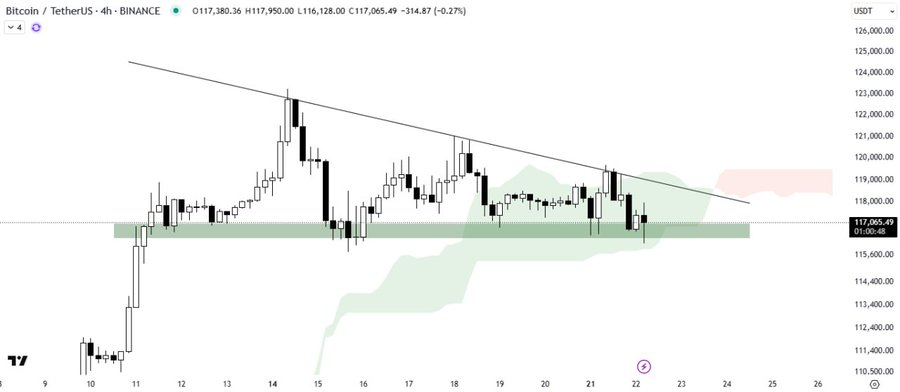
Source: TradingView
According to CoinGlass data, the trading volume rose by 43.98% to $102.33 billion. The open interest decreased moderately by 0.29% to $84.75 billion. This is an indication that traders are protecting profits or hedging. The OI-weighted funding rate is at 0.0111% which indicates that a slight long bias exists.
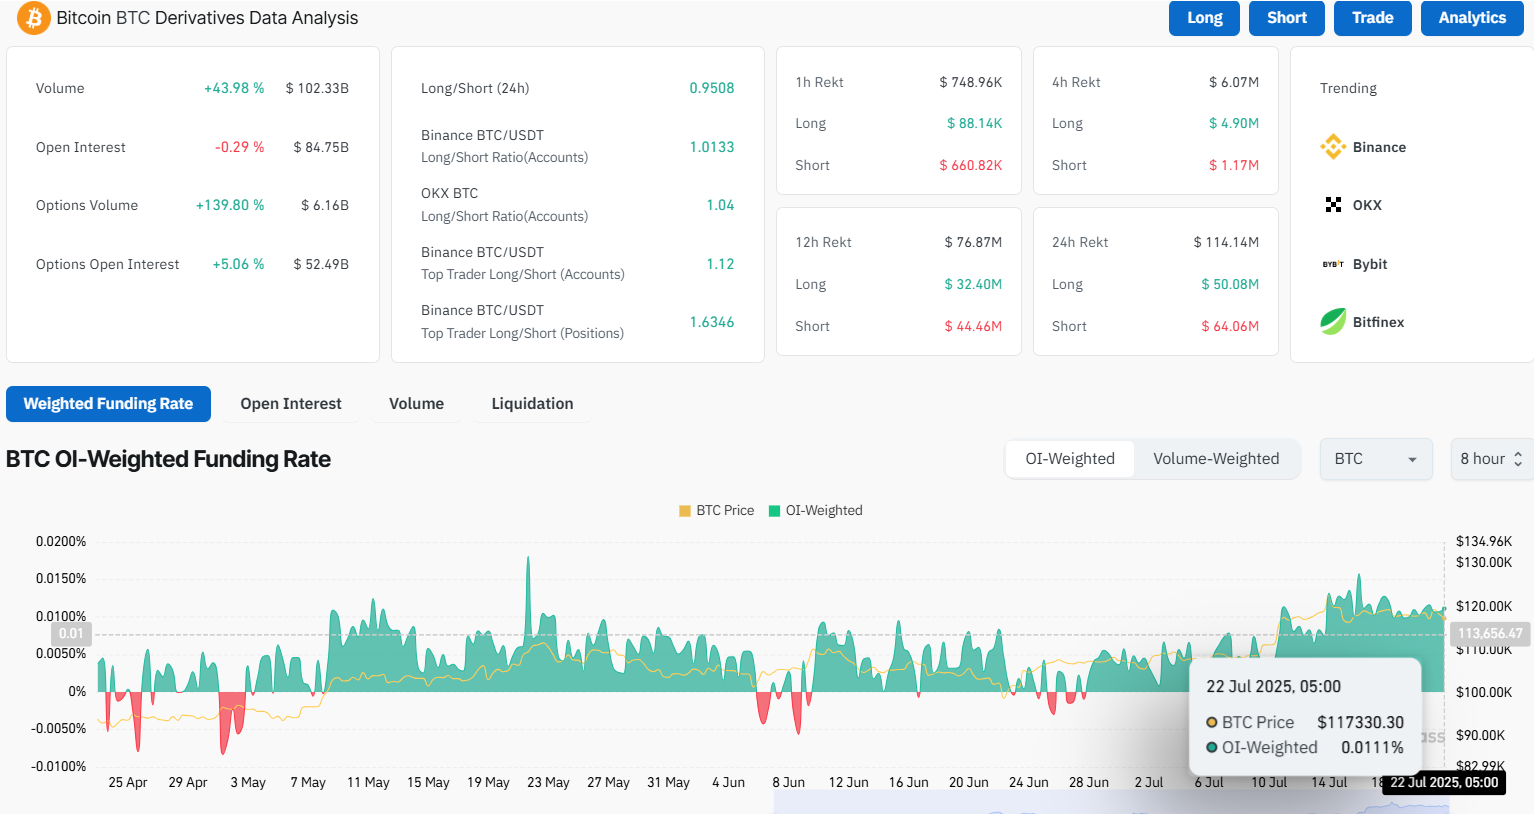
Source: CoinGlass
Bitcoin at Crossroads
The Crypto Express revealed a descending triangle taking shape on the chart. Bitcoin remains well above an important demand area. The price rests within the Ichimoku Cloud as well. This shows a lack of short-term direction. A bullish continuation could be confirmed in a breakout above the cloud. A breakdown may create new selling pressure.
Source: X
The immediate future of Bitcoin relies on action at the level of about $118,000. A break of this level can initiate more gains, up to $121,000 and more. Any inability to maintain existing support will push prices downward. MACD and RSI should be followed carefully by traders.
The market is data-driven as Bitcoin shifts between pressure zones. Volume, interest, and technicals indicate a slightly cautious but spirited trading environment. Not much dominance as yet. The next move will depend on the price reaction at the resistance level.
Also Read: Strategy Adds $739 Million in Bitcoin, Boosting Unrealized Gains to $28.5 Billion