
Pudgy Penguins (PENGU) Price continues defending a crucial support zone while attempting to build short-term recovery momentum. A breakout above descending resistance could strengthen bullish sentiment, whereas losing support may trigger further downside. Meanwhile, RSI and MACD suggest bearish pressure is fading, although buyers have yet to secure full control.
PENGU Price Holds Gains Amid Market Uncertainty
Pudgy Penguins (PENGU) continues to show short-term strength, extending its recent upside momentum. Over the past 24 hours, PENGU has gained nearly 6.93%.
However, on a broader timeframe, the token remains under pressure, posting a 7.27% decline over the past week.
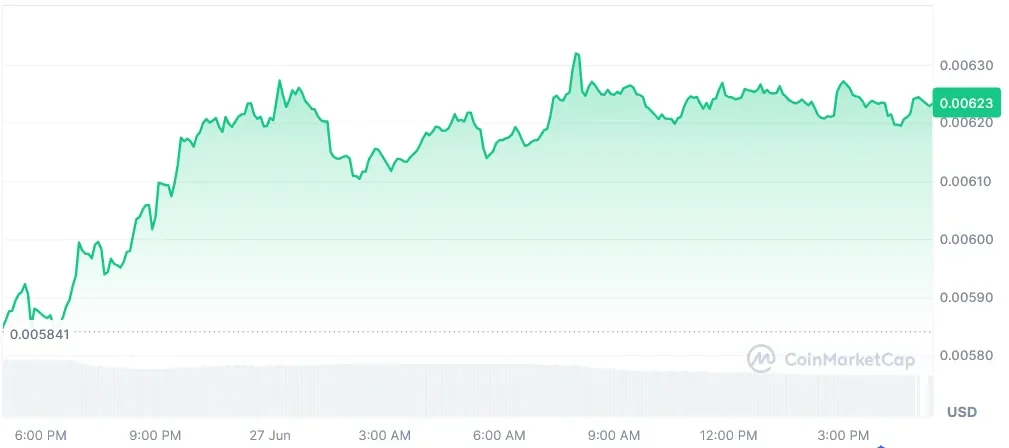
According to CoinMarketCap data, PENGU is trading at $0.006227, while its 24-hour trading volume dropped 25.07% to $65.16 million.
Meanwhile, market capitalization is valued at $392.79 million, marking a 6.94% increase over the same period as momentum strengthens.
Also Read: PENGU Price Gains Attention After Pudgy Penguins Launches 3% Cashback Card
PENGU Tests Critical Technical Support
PENGU price remains in a long-term bearish trend, trading beneath a descending resistance trendline that has capped every major recovery since October 2025.
Price has returned to a strong horizontal support zone around $0.0058–$0.0062, creating a large descending triangle formation with tightening price action.
The horizontal support has repeatedly attracted buyers, while lower highs confirm persistent selling pressure.
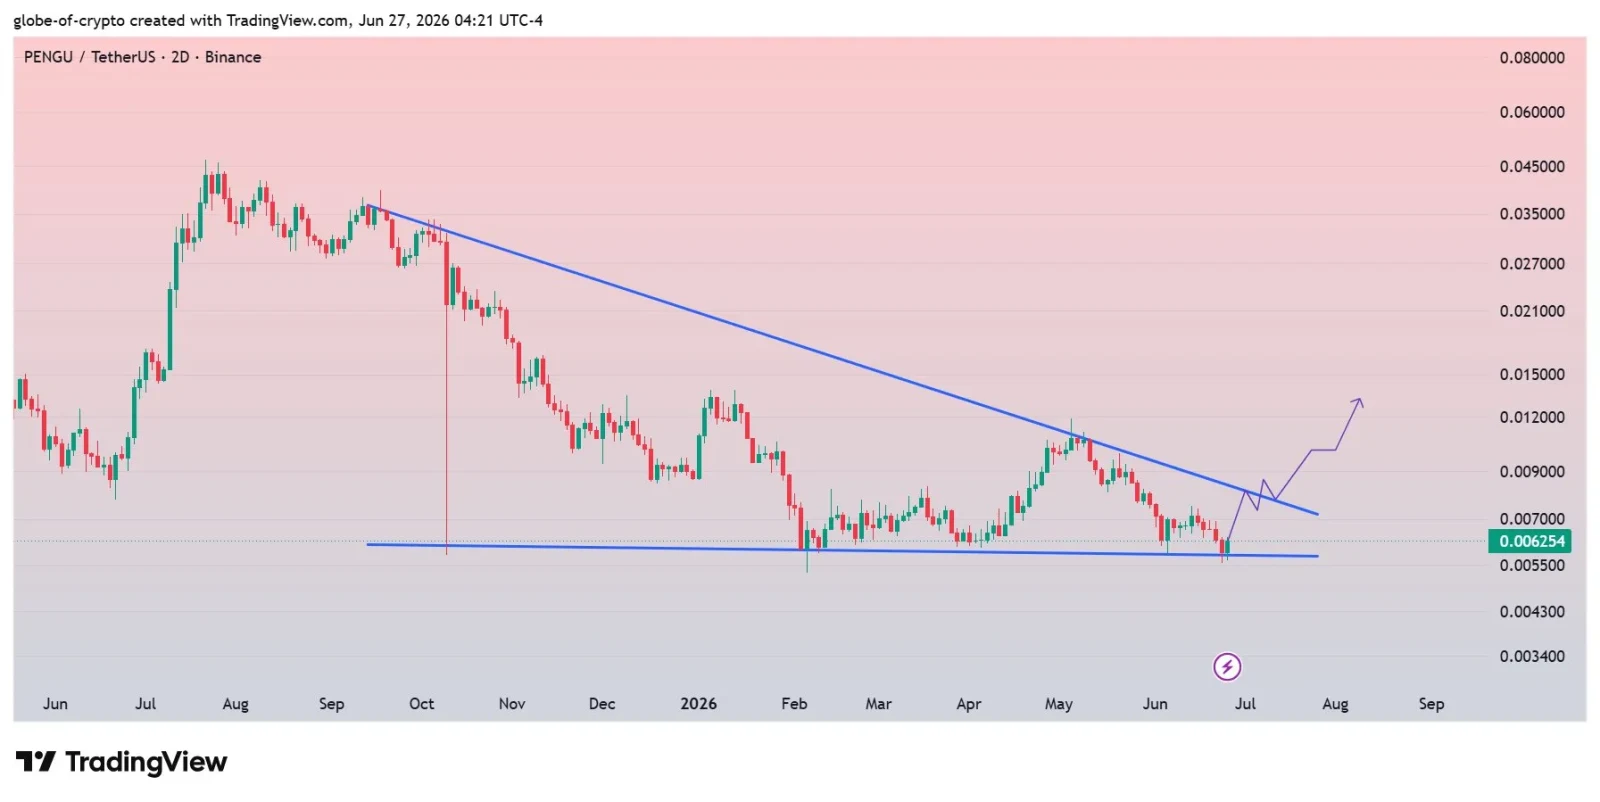
A decisive breakout above the descending trendline could invalidate the bearish structure and initially target $0.0090, followed by $0.0120–$0.0130, as illustrated by the projected bullish path, according to the crypto analyst, Globe Of Crypto.
PENGU is currently trading at an important support level. Remaining above the $0.0060 level will enable the stock to remain positive.
A break below that support level with increasing volume will be indicative of bearish dominance with higher chances of downward movement.
RSI and MACD Signal Momentum Stabilization
According to technical momentum indicators, bearish pressure has been showing signs of weakening, but a bullish momentum has not formed. The RSI (14) is 38.93 while the signal average for the same is 39.48.
This shows that momentum is still below the neutral 50 line and that sellers continue to have control in the short run. However, the RSI is trading above oversold levels.

Conversely, the MACD line is sitting at -0.00039, which is in complete harmony with its signal line at -0.00039, while the histogram remains at 0.00000. Such a setting is indicative of decreasing bearish momentum following the selling trend in the recent past.
Overall, PENGU is definitely a critical juncture from a technical perspective. In light of improving momentum, solid support, and ongoing growth in the ecosystem, there is room for cautious optimism among the bulls.
A breakout above the downward-sloping resistance line, however, remains necessary for the bears’ wave to be considered broken. It is therefore imperative that we keep our eye on prices and volume.
Also Read: PENGU Price Eyes $0.43 Breakout After Descending Wedge Formation