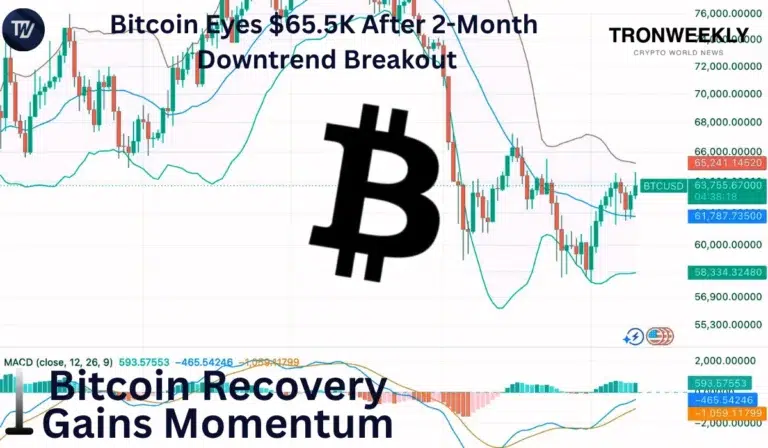
Bitcoin has broken above its daily descending trendline for the first time in nearly two months, according to technical analysis shared by crypto analyst Ash Crypto on X.
The breakout has renewed optimism among traders, although analysts stress that a larger bullish confirmation still depends on clearing a major resistance zone.
The leading cryptocurrency now faces resistance between $64,500 and $65,500, an area that could determine whether the recent recovery develops into a sustained upward trend. Investors are also monitoring chart patterns that suggest a potential shift in market structure.
Bitcoin Breaks Above Key Two-Month Trendline
In an update posted on X, Ash Crypto stated, “Bitcoin has broken out of its daily downtrend for the first time in two months.” The analyst noted that breaking the descending resistance line represents the first technical sign that bearish momentum may be weakening.

However, the breakout alone does not confirm a trend reversal. Technical analysts generally look for follow-through buying and sustained closes above nearby resistance before declaring a new bullish phase. Until then, the breakout remains an early signal rather than a confirmed trend change.
Also Read: Corporate Bitcoin Treasury Holdings Reach 1.26 Million BTC After Record Q2 Buying
$64,500 to $65,500 Remains Critical Resistance
According to Ash Crypto, Bitcoin must “break through $64,500-$65,500 resistance zone and hold above it” for bullish momentum to continue. A successful move above that region could encourage additional buying interest and improve market sentiment.
The analyst also highlighted the formation of a potential inverse head-and-shoulders pattern, a chart structure that traders often associate with bullish reversals. While the pattern remains incomplete, confirmation would require Bitcoin to decisively move above its neckline with strong trading volume.
Technical Signals Align With Broader Market Interest
The latest technical developments come as institutional participation in BTC continues to expand. Since the launch of spot BTC exchange-traded funds (ETFs) in the United States earlier this year, digital assets have attracted increased attention from traditional financial institutions, contributing to higher market liquidity.
Broader macroeconomic conditions also remain an important factor. Expectations surrounding interest rate decisions, inflation data, and global risk sentiment continue to influence capital flows into cryptocurrencies, making technical breakouts more meaningful when supported by favorable macro trends.
What Traders Should Watch Next
For traders, the immediate focus remains on whether BTC can establish support above the $64,500-$65,500 range. A successful breakout could strengthen confidence in a broader recovery, while rejection from resistance may extend the current consolidation.
Long-term investors should also monitor trading volume and institutional inflows rather than relying solely on chart patterns. Although the breakout has improved short-term sentiment, confirmation from both price action and broader market participation will be essential before declaring the correction complete.
Also Read: BitGo Expands Bitcoin Wallet Security With Quantum Protection Tools
This article contains market analysis and price predictions. These are not guarantees. Crypto markets are volatile. Always DYOR. Not financial advice.