• Skip to primary navigation
  • Skip to main content
  • Skip to primary sidebar
  • Skip to footer
  • About us
  • Write for us
  • Terms and Conditions
  • Privacy Policy
  • Disclaimer
  • Contact
  • All Posts
  • Advertise

TronWeekly

Crypto World News

  • Home
  • Education
    • Best TRON Wallets
    • Beginner’s guide to TRON
  • Opinion
    • Tron Tokens
    • Market Analysis
  • Industry
    • Tron Exchange
    • Project Review
  • Press Release
  • Advertise
  • About us
    • The Team
    • Editorial Policy
    • Write for us
    • Privacy Policy
    • Disclaimer
    • Terms and Conditions
    • Contact
You are here: Home / News / Bitcoin News / Bitcoin continues its bearish struggles as price stagnates
Bitcoin Price Bear

Bitcoin continues its bearish struggles as price stagnates

December 31, 2019 by Akash Anand

Bitcoin has had its fair share of highs and lows this year and December was no different. During a time when investors and holders were having fraught thoughts over the condition of the world’s largest cryptocurrency, Bitcoin’s value continued to float in the $7000- $8000 region. At press time, Bitcoin was making no effort to close the year on a high as it traded for $7225.7.

1-hour:

hourly btc

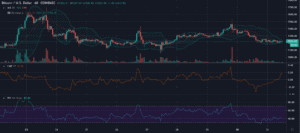
The hourly chart for Bitcoin showed a slow down in the price as the immediate support held at $7205. The Bollinger bands were converging towards each other as the bear market held strong.

The Relative Strength Index was near the oversold zone and had begun a rise. Bitcoin’s performance on the hourly chart stated that selling pressure was more than the buying pressure.

The Chaikin Money Flow indicator was above the zero line during the hourly spectrum. This meant that the incoming capital was more than the outgoing capital, a positive sign for the investors.

1-day:


daily btc

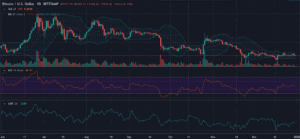
The 1-day chart for Bitcoin displayed a flat movement for the price as the immediate support held at $7125. The Relative Strength Index on the daily chart was in the middle of the graph, a sign of the selling pressure and the buying pressure cancelling each other out.

The RSI was mostly near the oversold zone as the selling pressure in the market has been on a constant high after the bear crash. The last time the RSI was near the overbought zone was in October when the price had shot up near the $9000 mark.

The Chaikin Money Flow indicator on the daily spectrum was below the zero line. This was an indication that the capital leaving the Bitcoin market was much more than the capital coming into the market.

The Bollinger bands were reflective of the price candles as the upper band and the lower band moved parallel to each other. The parallel movement signified the lack of price fluctuations for Bitcoin and users were convinced that the stagnant movement would continue for a while.


Filed Under: Bitcoin News Tagged With: Bitcoin (BTC), Price Analysis

Primary Sidebar

Recent Posts

  • OKX CMO’s Bold Bitcoin Proposals Receive Surprising Support In Public Vote March 24, 2023
  • Bitcoin’s Value Debate: Diversification Vs. Long-Term Hold Amidst Uncertainty  March 24, 2023
  • Cardano Trading Pair Delisted Citing Low Trading Volume March 23, 2023
  • Ripple CTO Slams SEC’s Coinbase Crackdown: Incompetence Or Insider Protection? March 23, 2023
  • TRON’s Justin Sun Posts Cryptic Tweet After SEC’s Lawsuit March 23, 2023

Footer

News

  • Altcoin News
  • Bitcoin News
  • Blockchain
  • Tron News
  • World

Digest

  • Meet the Founder
  • Price Winning Article
  • DeFi
  • Cyber Security
  • Crypto Scam

Industry

  • Project Review
  • Technology
  • Fintech
  • Tron Exchange
  • New in Town

Tron Universe

  • Event and Tron Parties
  • New in Town
  • Tron Tokens

Follow Us

Subscribe US

Copyright © 2023 · Tron Weekly. All Rights Reserved. NOTE: Tron Weekly is an independent crypto news site that adheres to the strict journalism policy anchored on transparency, trust, and objectivity, we have no affiliation with the TRON Foundation, its founder Justin Sun or any other cryptocurrency firm.