
- Bitcoin (BTC) is now relying on the $8000 support but may retest the $9000 resistance before dropping further.
- Bitcoin’s price shapes in a new descending channel after breaking out of the triangle patterns.
After breaking the $9000 essential support on September 24, Bitcoin found support at $8000, followed by a quick rebound to $8400 – where BTC is now trading at. Up till now, the market has since remained in a consolidation mode, deciding on the next actual move.
However, we can expect the market to continue to sell as soon as the bears regroup. In case the bulls show strong commitment, Bitcoin may climb back to the critical resistance levels.
Bitcoin’s Current Statistics
Trading Price: $8146
Market Capitalization: $152,087,730,129
Trading Volume: $17,455,199,628
Key resistance levels: $8600, $8800, $9000
Key support levels: $8000, $7526, $7000
Bitcoin Price Prediction for September 26, 2019
The September 24 sudden shock-wave has made Bitcoin’s price to bottom at $8000, breaking the symmetrical triangle at $10000 and the important descending triangle at $9000 – which was forming for the past months. The bearish scenario has now brought Bitcoin in a new descending channel pattern – which may lead price to the $6000 zone in the next bearish run.
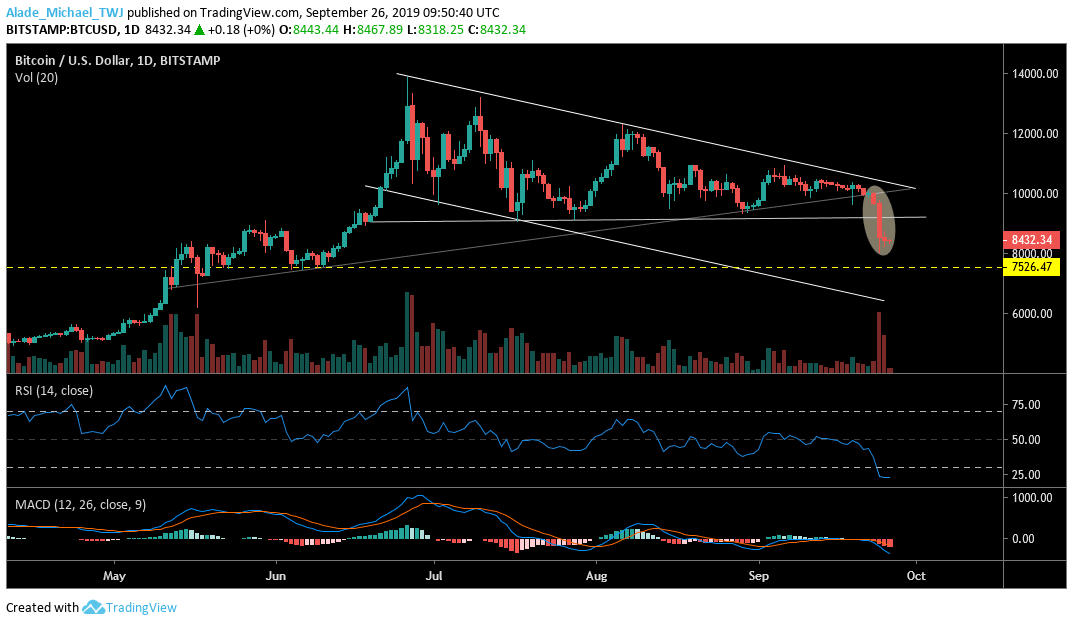
While BTC/USD pair consolidates at around $8400 for two days, the price may fall back at the $8000 holding support before slipping further to $7526 support – the June low. Driving beneath this support could plummet price at $7000 support and beyond. On the other hand, a quick retracement may allow the price to retest the $8600, $8800, and $9000 resistance. Still, Bitcoin remains bearish at the moment.
Conclusively
This might just be the beginning of the drops for Bitcoin considering the newly descending channel formation on the daily chart. We may see a more severe decline in the next couple of days if the bearish trend continues to shape in a pattern formation. And if Bitcoin shows strength, the important level of $9000 may be revisited.
Technical Indicator Reading
RSI for Bitcoin price is hugely in the oversold territory following the recent $1600 price cut. A possible bullish may play out if the indicator can turn positive.
MACD is still reflecting an ongoing bearish action in the market as Bitcoin remains in the negative zone. A positive cross should provide a buying opportunity.
Disclaimer: The presented information is subjected to market condition and may include the very own opinion of the author. Please do your ‘very own’ market research before making any investment in cryptocurrencies. Neither the writer nor the publication (TronWeekly.com) holds any responsibility for your financial loss.
Never miss our daily cryptocurrency news, price analysis, tips, and stories. Join us on Telegram | Twitter or subscribe to our weekly Newsletter.