
Bitcoin has been consolidating around a significant resistance level, but some analysts believe that the current pattern could lead to a bearish breakdown, similar to a previous pattern. This is because the current market scenario is at a critical point, where attempts at a reversal face technical resistance.
At the time of writing, Bitcoin is trading at $76,329 with a 24-hour trading volume of $45.99 billion and a market cap of $1.53 trillion. BTC price increased 0.29% in the last 24 hours, according to CoinMarketCap data.
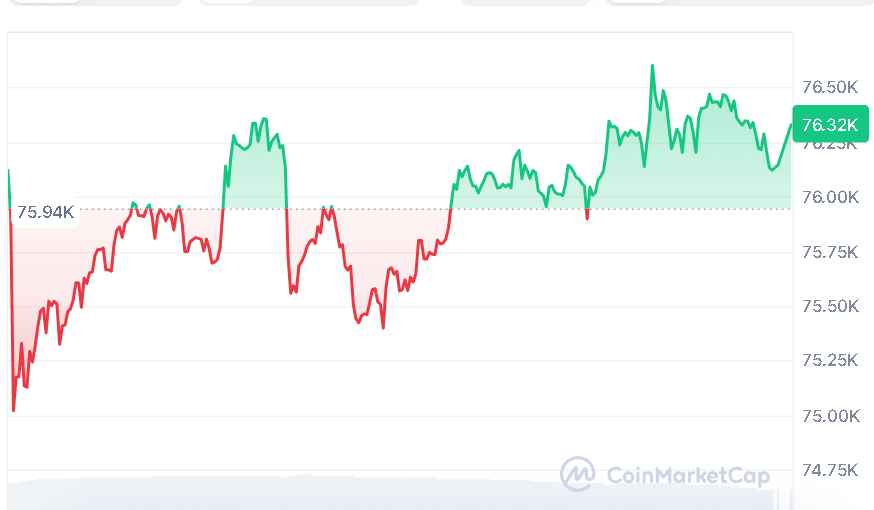
Source: CoinMarketCap
Also Read | Kbank Supercharges Digital Asset Infrastructure with Ripple Custody in Korea 2026
Bitcoin Faces Key Bearish Rejection
On April 30, 2026, crypto analyst Crypto Patel observed a technical configuration where Bitcoin seems to have fallen into another bearish pattern, which is very reminiscent of the one that resulted in its drop from the $98,000 area in the first place.
As can be seen in the publicly available chart pattern, the price action is showing significant sensitivity within the bearish order block at the $78,000 to $80,000 range.
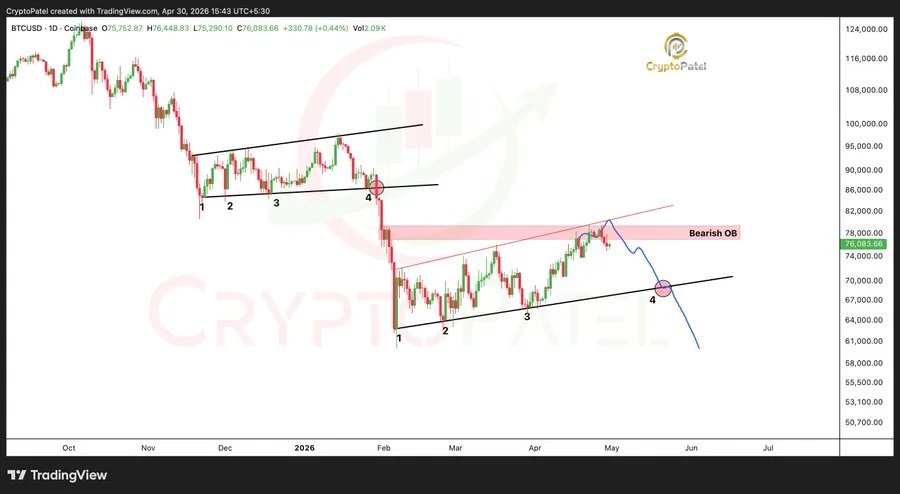
Source: Crypto Patel’s X Post
The conclusion drawn from the analysis is that the rejections seen by Bitcoin within this area may signal a failed resistance at the fourth stage of development, which has historically signaled a continued bearish trend.
This bearish outlook will be conditioned by a sustained daily close above $80,000. The latter will negate the present breakdown pattern and could signal a reversal to bullish continuation.
Bitcoin Momentum Weak Amid Uncertainty
Technically, Bitcoin still gets mixed readings on its performance metrics. RSI sits slightly higher at 44.97, which indicates that the currency shows a lack of momentum with only slight improvement from recent lows.
The price is trading around the ribbon of moving averages, but more importantly, the simple moving average of 20 days at $76,475 acts as resistance. Further resistance is found at $87,856 and $95,681, while support lies at $60,502 in the long term.
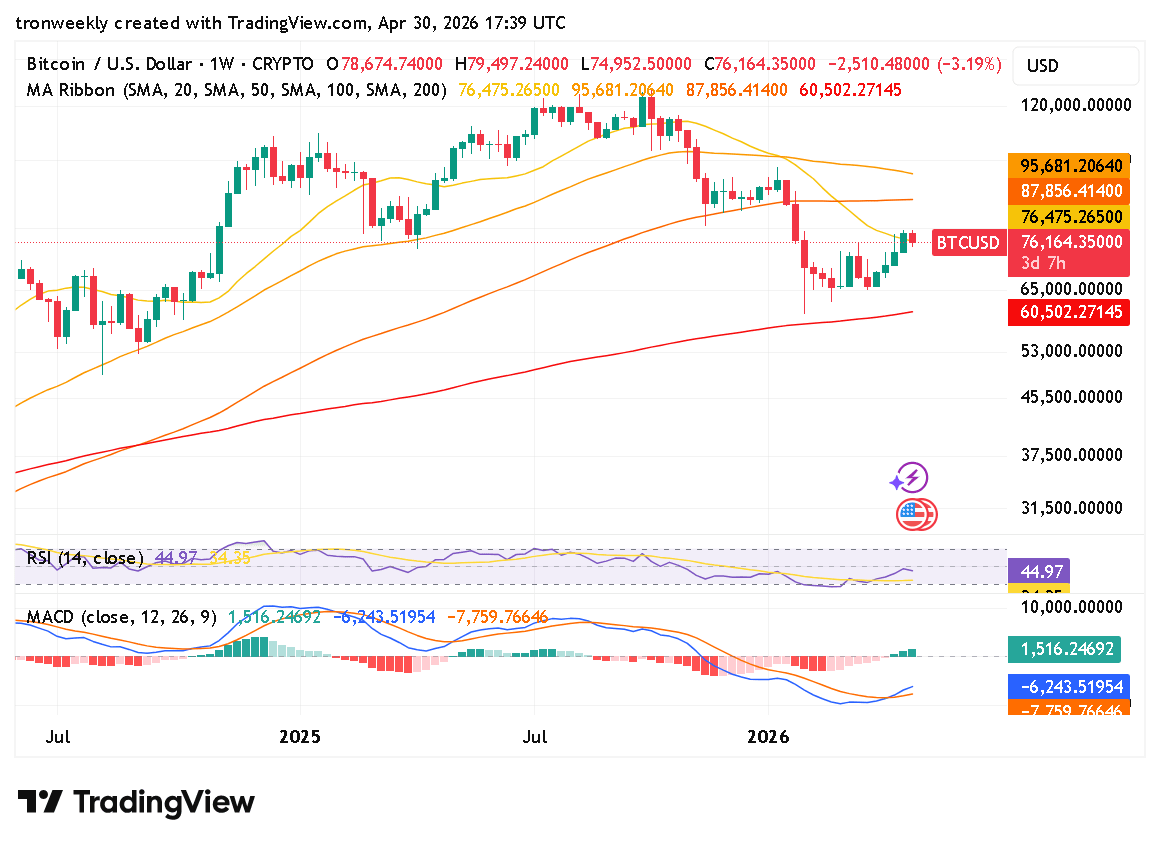
Source: TradingView
Momentum indicators also capture the element of uncertainty. The MACD is still below the zero level, with the MACD line and the signal line at -6,243 and -7,759, respectively, implying that there is still bearish momentum. Nonetheless, a small positive value in the histogram (+1,516) implies that the selling momentum might be easing.
In conclusion, Bitcoin is currently within a highly significant technical area where any efforts to bounce back in the short term face tough opposition from overhead resistance. It will be interesting to see how the coin fares in terms of retaking higher ground.
This article contains market analysis and price predictions. These are not guarantees. Crypto markets are volatile. Always DYOR. Not financial advice.
Also Read | Eric Trump Reiterates $1 Million Bitcoin Forecast at Bitcoin 2026