Bitcoin price is seeing increased pressure following the breakdown below an important resistance level, and there is doubt whether it will prove to be a support. In the meantime, Morgan Stanley is accumulating more Bitcoin through the ETF.
Table of Contents
At the time of writing, BTC is trading at $83,940, with a 24-hour trading volume of approximately $66.10 billion and a market capitalization of $1.68 trillion. BTC has fallen about 2.18% over the last 24 hours.
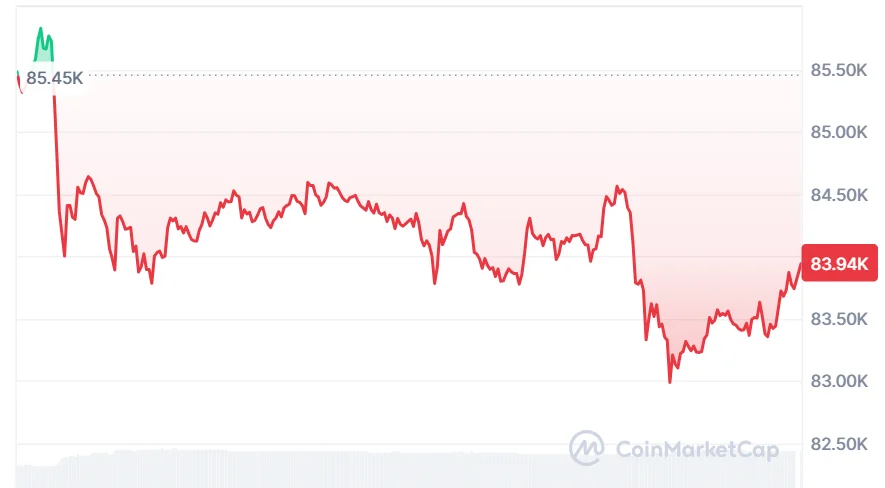
The latest action has brought into question whether the $82,000-$83,000 level can now be used as support after earlier being resistance for the higher timeframe.
Also Read | XRP ETF Inflow Reaches $1.73 Billion as XRP Price Drops 7%
Bitcoin Price Falls Below Key Zone
On September 24, crypto analyst Wealthmanager noted that Bitcoin had swiftly fallen under the $83,000 mark. According to Wealthmanager, $82,000-$83,000 was an important level to watch for during the ongoing pullback.
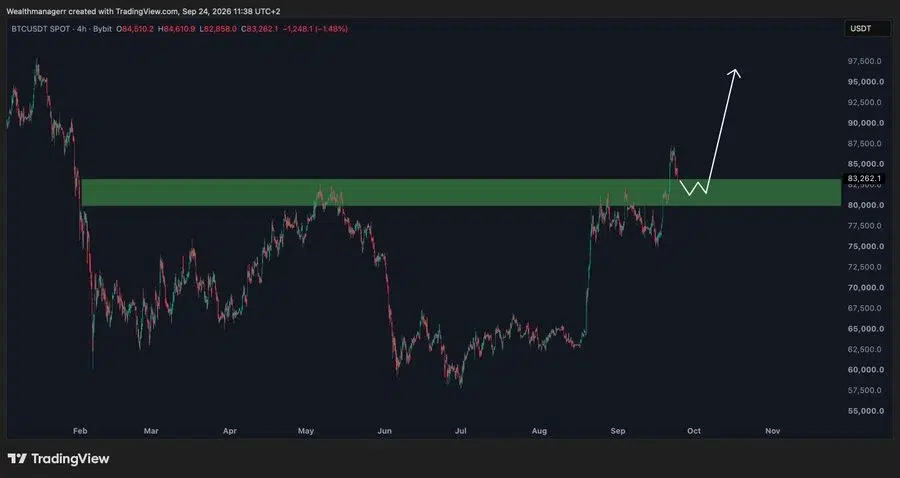
The key question is whether the region will be regained and held during another test of it. The ability of the level to attract buying pressure may assist in stabilizing the recent recovery process. If the region is consistently traded under, this will mean that Bitcoin finds it difficult to hold the recovered levels.
The reason this is relevant is that the BTC price had gone from around $76,000 mid-September to above $87,000 during the week prior. Looking at historical price data, the highest intraday price BTC had hit was $87,363.76 on September 21.
Another reason for the upward price momentum has been strong flows and short covering. As reported by The Wall Street Journal, Bitcoin hit its eight-month high above $86,000 during the week.
Morgan Stanley Continues Bitcoin ETF Buying
According to information from Arkham Intelligence as of September 24, there have been instances of buying activity from MSBT within a number of trading periods.
An update from September 24 revealed that Morgan Stanley had inflows amounting to $32.4 million on September 23, and a total of $193.1 million within three consecutive days.
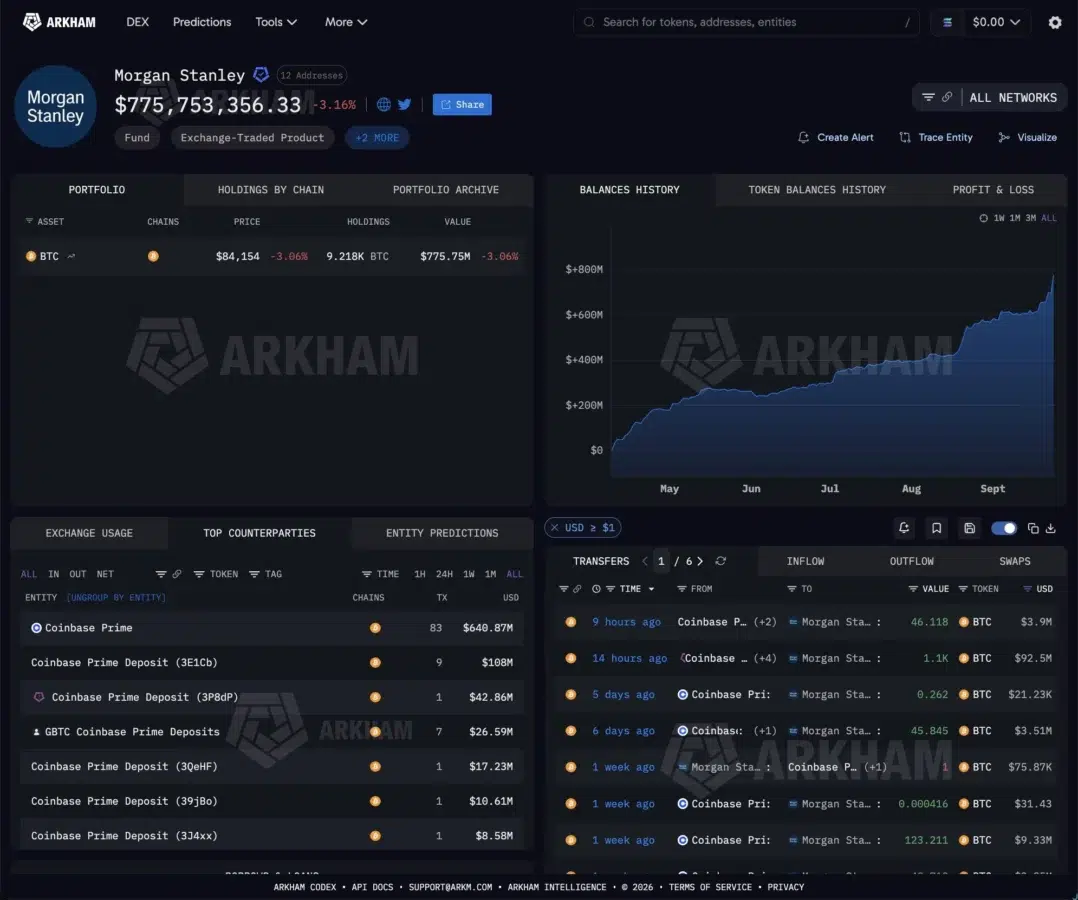
It should be noted that this institutional interest comes at a time when the Bitcoin market is seeing selling pressure in the short run.
Bitcoin Price Momentum Remains Positive
The technical indicators are not painting an entirely positive picture either. Currently, the price of Bitcoin is trading above the middle line of the Bollinger Band at the price of $79,715, considering the level given for the analysis. Meanwhile, the upper line is trading at $86,208, and the lower one at $73,222.
BTC trading above the middle line of the Bollinger Band keeps the overall bullish formation alive, although BTC price is currently drifting away from the upper line after failing to hold the recent gains.
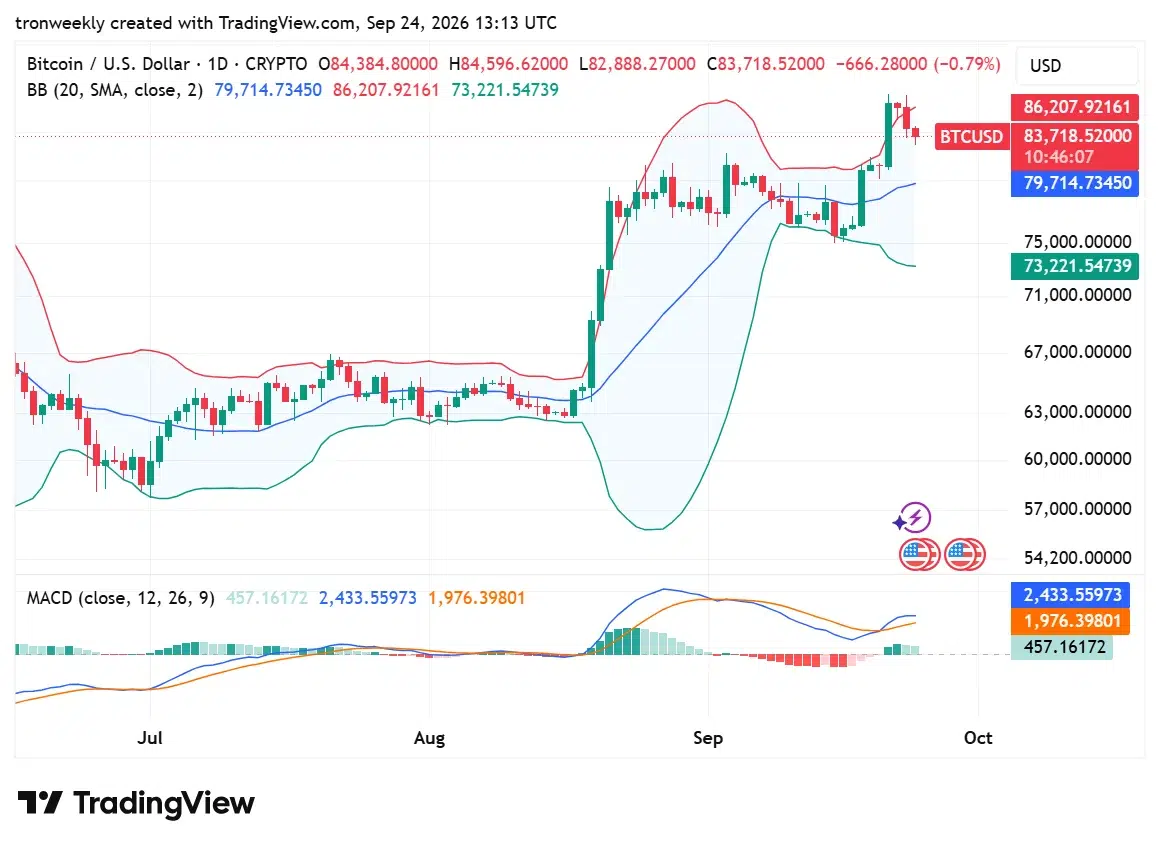
The MACD stays above the signal line, with the MACD valued at about 2,433.56 against 1,976.40 on the signal line. The histogram is also positive, with a value of about 457.16.
This means that even as the recovery continues to face pressure from sellers, it maintains some form of technical support from the market.
What Happens Next for Bitcoin Price?
The next major challenge is for Bitcoin price to recapture and sustain itself in the $82,000-$83,000 range.
If it is able to sustain itself above the range, the focus may shift to the more recent highs of $86,000-$87,000. Any break below this range would mean greater significance being assigned to lower levels of support.
From the perspective of a Bitcoin investor, the key point here is that although the recent pullback has not broken down the recovery pattern, the $82,000-$83,000 range now faces the challenge of providing support.
Also Read | Binance HYPE Listing Signals Growing Interest in Hyperliquid’s Ecosystem
This article contains market analysis and price predictions. These are not guarantees. Crypto markets are volatile. Always DYOR. Not financial advice.