- Bitcoin’s tightening Bollinger Bands signal potential volatility and a major price shift ahead.
- The $100K and $110K levels are critical, with a breakout potentially driving a Bitcoin rally.
- A rising triangle pattern indicates bullish momentum, with targets ranging from $109K to $118K.
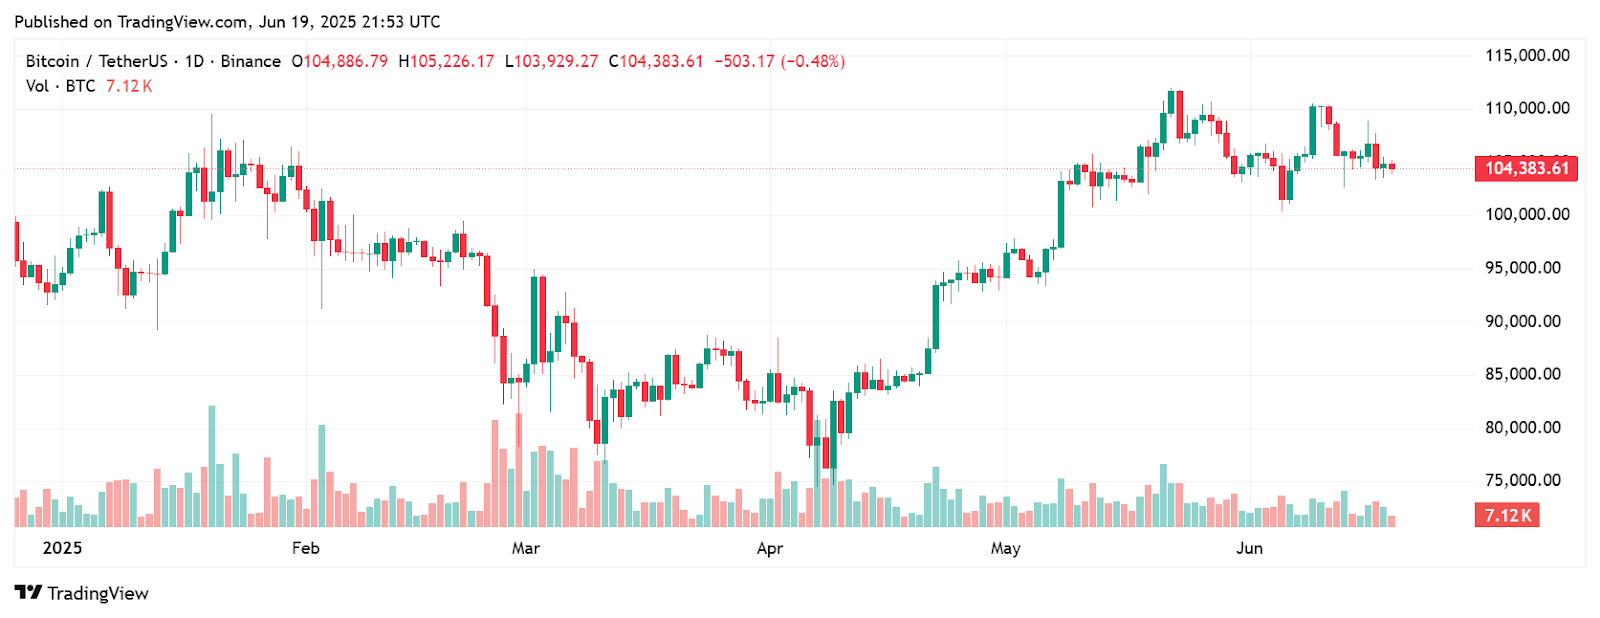
Bitcoin movement in the market has been in the spotlight with its Bollinger Bands tightening up, giving possible hints of a volatile future. Analyst Daan Crypto Trades highlighted that band squeezes had taken place in the current consolidation period.
The tightening indicates that Bitcoin is gearing up towards a major price adjustment. The bottoms and tops of the bands align closely with Bitcoin’s latest monthly lows and highs, with special emphasis on the $100K and $110K price points.

Source: X
The movement of the Bollinger Band, tightening with twin patterns of bullish ascending triangles, has generated tension in the marketplace. Alternatively, traders are eagerly waiting to detect a potential breakout that will initiate a rally. As Bitcoin consolidates at the moment, these technical indicators point to an opportunity for a major price movement in the near future.
Bitcoin Poised for Upswing
These are significant levels that traders should follow. When the Bollinger Bands are close together, this generally means that a breakout is in the cards, as Bitcoin is usually prone to a surge once the volatility sets in.
The current areas of support and resistance found at $100K and the $110K become vital in influencing the upcoming major movement upwards or downwards. As of press time, BTC is trading at $104,383, with a 0.61% decrease in 24 hours. It has gone down by 1.96% in the past 7 days, with a 24-hour trading volume of $37.1 billion.
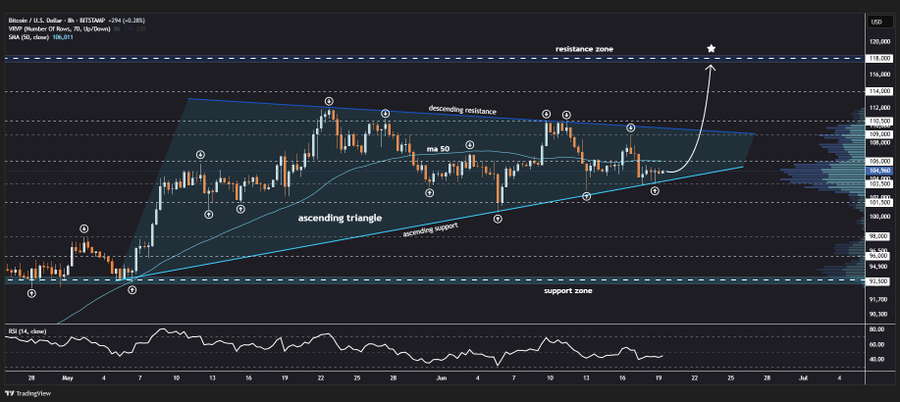
Analyst Jonathan Carter revealed that Bitcoin is rebounding off the lower support of a rising triangle structure on the 8-hour chart. This chart pattern is generally a sign of bullish activity, which means that Bitcoin could be on the edge of a big upswing if the pattern continues.
Critical Resistance Levels
BTC may soon rise and overcome the 50-period moving average (MA 50), and it will probably increase in price. Breaking out above this crucial level might send BTC on a path towards a new row of price targets, such as reaching $109,000, $110,500, $114,000, and even peaking towards $118,000. These price levels have been the target of interest as this digital asset keeps finding its boundaries.
Source: X
Traders and investors are keen on these general technical signals as the cryptocurrency market is volatile. The $100k and $110K marks are currently becoming very crucial to decide whether BTC will jump off to a new bullish stage or continue the consolidation phase.
Read More: Bitcoin Bull Run Stalls as Whales Trigger Major Sell-Off Above $100K