
Bitcoin’s market movements have caught the eye of seasoned analysts, revealing patterns that echo past cycles, albeit with distinct nuances this time around. According to CryptoCon, Bitcoin’s current “Blue Year” mirrors previous cycles in its broad structure but with a twist.
Historically, the Blue Year has exhibited two significant peaks followed by two periods of sideways trading. This cycle, however, has deviated slightly, with a more intense surge between January and March, leading to a prolonged correction afterwards.
CryptoCon emphasizes that no previous cycle has reached all-time highs (ATHs) during the Blue Year as our current cycle has. This unprecedented achievement is, perhaps, why the ongoing correction has been unusually extended. Typically, it takes about a month for Bitcoin to find its bottom after hitting a peak, yet this time, we’re approaching five months without a clear bottom.
Despite these differences, there’s a silver lining. CryptoCon notes that in every prior cycle, Bitcoin’s second peak in the Blue Year (marked by a light blue circle on their charts) has found its bottom around August. This pattern suggests that the recent August dip might be the anticipated bottom.
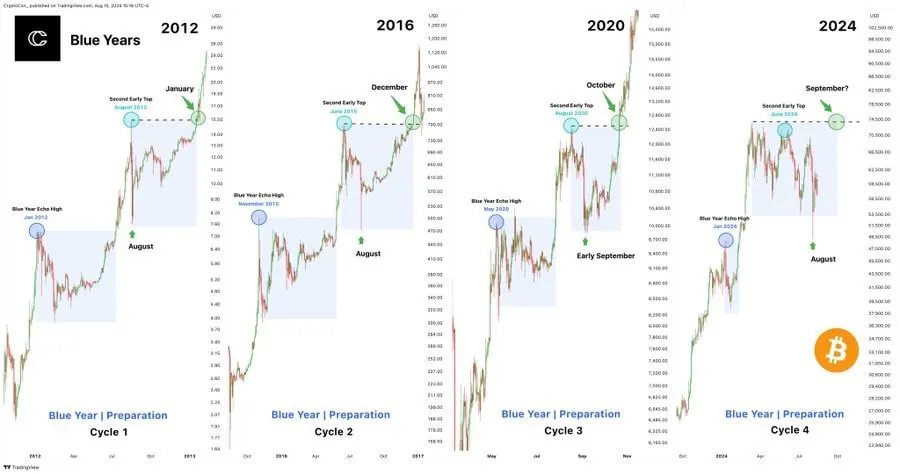
Interestingly, the month in which Bitcoin has historically made new highs after finding its bottom has been gradually shifting forward with each cycle. Could September be the month when we see new highs this year?
Mags’ Bearish Cross for Bitcoin, Short-Term Weakness
On the other hand, another analyst, Mags, has pointed to a bearish signal on the daily chart for Bitcoin. According to Mags, Bitcoin just saw a bearish cross, with the 50-day moving average slipping below the 200-day MA. This is normally seen as an indication of short-term market weakness.
It is the second bearish cross after the low of $15,500. The last bearish cross was in September 2023, where it then traded around $25,000. The price later moved sideways for some weeks before being able to reclaim the moving averages, resulting in a bullish cross and a consequent rally.
Mags, commenting on the pattern, opines that if it sticks, Bitcoin will face several weeks of choppy price action before maybe being able to recover the MAs. They note that the breach of this declining line, which is joining the moving averages, represents a bullish trend confirmation that would be completed with another bullish cross.
These are all analyses that converge together to one point: though there may be some turbulence for Bitcoin in the short run, the long-term view is fully in tune with historical cycles and thus argues for the potential highs ahead.
Related Reading | Floki Flashes Red with 25% Drop in a Month—Can It Surge 70%?