
Bittensor (TAO) price analysis shows the asset trading in a narrow range after a recent correction, as of April 30, 2026. Price action remains under pressure as momentum slows. Market participants continue to track key levels as consolidation shapes the current structure.
As of writing, Bittensor (TAO) is trading at $250, showing a decline of 2.89% in the past day. The trading volume is showing bearish, down 23.68%, and is currently standing at $199.35 million. Over the last week, the coin price has increased by 2.78%, according to CoinMarketCap.

Also Read: Bittensor (TAO) Price Consolidates as Key Resistance Zone Stands at $282–$283
TAO Pullback Deepens as Structure Resets
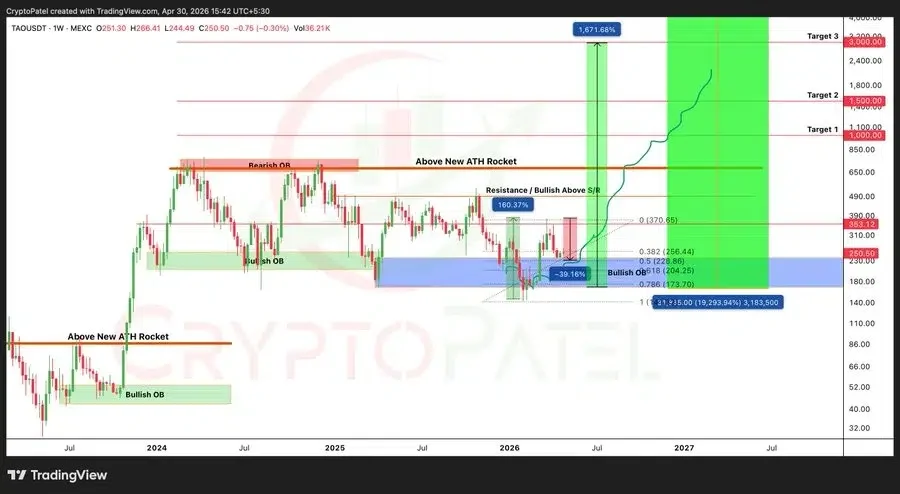
Crypto analyst Crypto Patel pointed out that the correction comes after a powerful impulsive rally. TAO has almost registered an upside of almost 160% and then retreated about 40% since reaching the high of $378. The asset is approximately 70% below its all-time high, indicating a longer timeframe reset.
The critical demand zone is between $204 and $173. This is within the range of the 0.618 to 0.786 Fibonacci retracement. Maintaining this zone favors a continuation bias, whereas a breakdown below $170 enhances the likelihood of a price move into the $100 area.
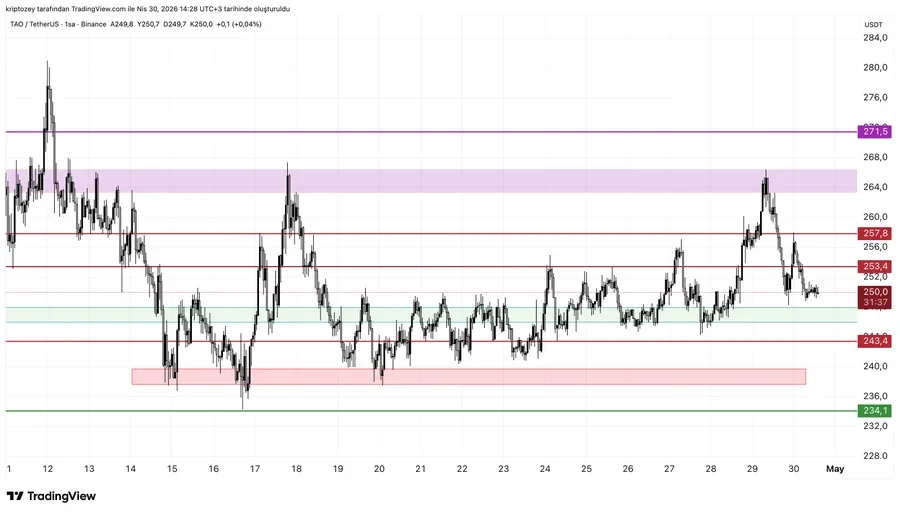
Moreover, another analyst, ZEY, mentioned that TAO is responding in the area of $250 and is unable to maintain support. The green zone is considered to be a less risky area of purchase, whereas the lower red area is the stop level. TAO price analysis highlights $253.40 as a key level for confirmation.
In case the price settles above the level of $253.40, then the upside targets are $257.80 and then the $264 range. If the price drops below $248, a retest at $243.40 is probable. A fall beneath that mark can speed downfalls to $234.
TAO Price Analysis Shows EMA Pressure
TAO price analysis on the daily chart shows price trading below key exponential moving averages. Immediate resistance is the 20-day EMA at 256.9. This resistance cluster is supported by the 50-day EMA of 258.8 and the 100-day EMA of about 256.0.
The 200-day EMA is higher at 271.20, which shows a wider weak trend since the price stays below it. This combination of EMAs forms overhead pressure. To change the short-term momentum, a reclaim of this zone would be necessary.

Bollinger Bands indicate decreased volatility. Upside attempts are limited by the upper band at around 267.1. The middle band of 250.7 is very close to the present price and serves as a pivot.
Near-term support is determined by the low band at 234.3. A move of price between the middle and lower bands indicates consolidation. The range suggests the absence of a strong directional bias over the short run.
This article contains market analysis and price predictions. These are not guarantees. Crypto markets are volatile. Always DYOR. Not financial advice.
Also Read: Cardano Price Prediction: Is ADA Preparing for a Long-Term Move Above $10?