
The BNB price stayed under market watch on Monday, July 6, 2026, as buyers tested a recovery setup after a recent rebound. Traders focused on the current chart pattern, with support and resistance levels set to guide the next move ahead.
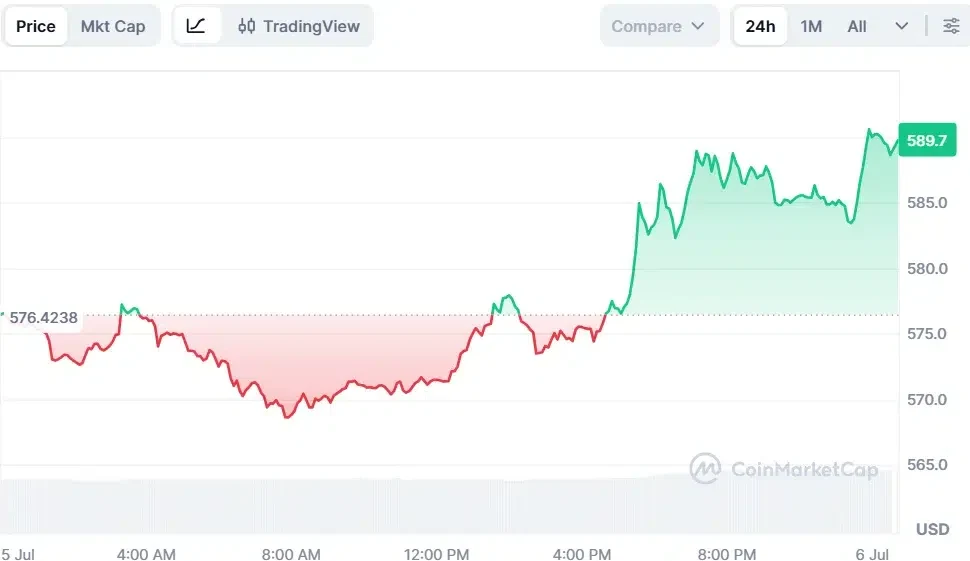
As of press time, Binance Coin (BNB) is currently trading at $589.89, marking an increase of 2.45% in the past 24 hours. CoinMarketCap data shows that the trading volume is currently standing at $1.28 billion, with a market capitalization of $79.5 billion. The token has also gained 7.49% in a week.
Also Read: Solana Price Eyes Breakout Above $82 as ETF Demand Continues to Grow
BNB Price Forms Rising Wedge as Momentum Slows
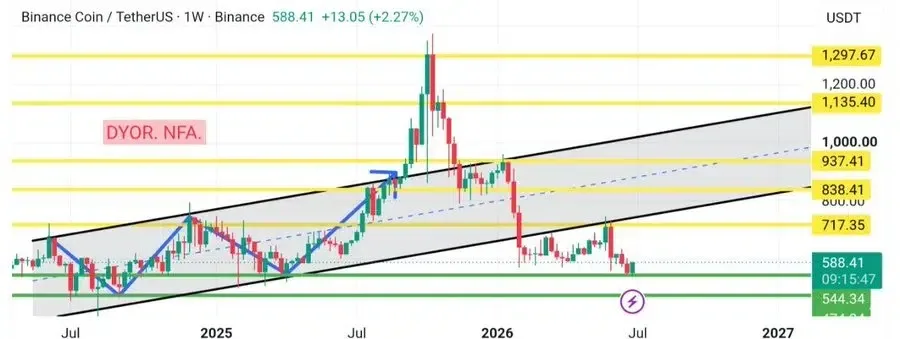
Analyst Crypto With Gopal noted that the BNB price is trading within a Rising Wedge, having undergone significant recovery. Such a formation indicates buyers interest, although positive momentum begins to decrease.
According to the analyst, the lower trendline acts as a key zone for the support level. In case of breakdown, there is an opportunity to initiate a temporary correction, while a clear breakout above the wedge will provide grounds for new bull runs.

Additionally, another analyst, The Boss, mentioned that markets rarely give unlimited chances to revisit major structures. For BNB, the focus is no longer only on the rally that already took place.
The analyst indicated the problem of the ability of the long-term channel to work as a support level in the future. The BNB price tested this region earlier, and moves from similar levels have led to strong advances on the chart.
Now, the green zones along with the lower support channel are responsible for the technical situation. The yellow levels remain the next targets above before the potential recovery.
RSI and MACD Signals Improving Momentum
BNB price momentum is also positive on the daily time frame. According to TradingView data, the Relative Strength Index (RSI) stood at 52.83 levels, whereas the RSI moving average is at 39.56 levels. MACD data showed the histogram is at 4.22, the MACD line at -10.86, and the signal line at -15.07.
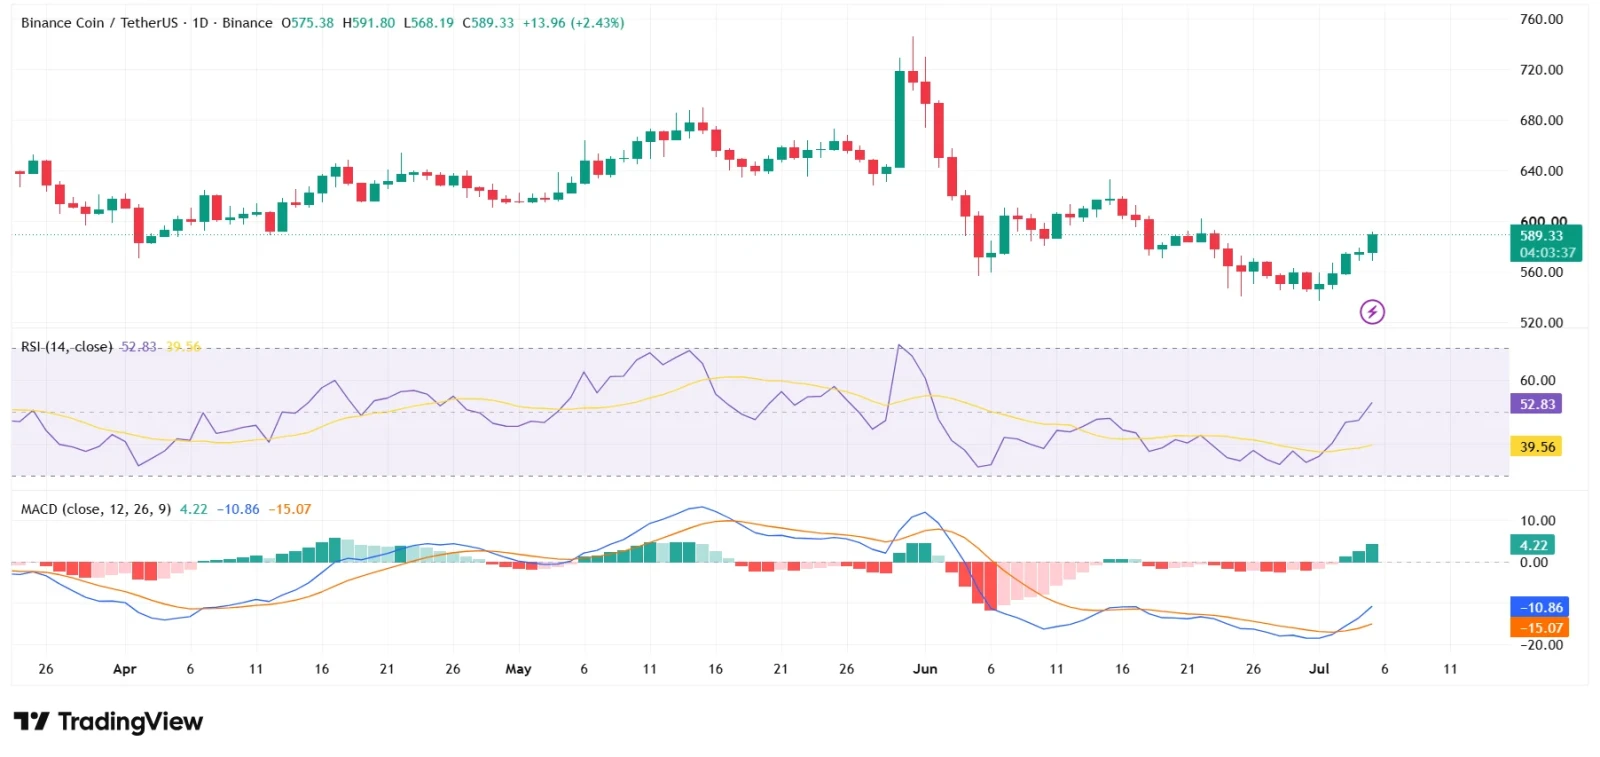
These readings pointed to a recovery attempt after recent weakness. The RSI held above 50, while the positive MACD histogram showed improving momentum. However, the MACD line stayed below zero, so stronger confirmation depends on a breakout with higher volume.
BNB Chain Growth Adds Context to BNB Price Recovery
BNB Chain achieved a major network milestone as well. According to data from Chainspect, Layer 1 blockchains surpassed 13.5 billion transactions since the mainnet launch.
This was an indication of continuous use of the network. The network is currently hosting almost $4.85 billion in total value locked and stands as the fourth largest blockchain based on its stablecoin holdings.
All these network stats give more meaning to the technical setup on BNB’s price. While BNB Chain is still active in trading, payments, and decentralized finance, the stablecoin holdings show the continuous need for liquidity.
For now, the BNB price continues to depend on the chart confirmation and the buyer support around the key level. A decisive pattern break may shape the next short-term direction for the token.
This article contains market analysis and price predictions. These are not guarantees. Crypto markets are volatile. Always DYOR. Not financial advice.
Also Read: Cardano Price Recovery Accelerates Following Breakout Above 200 EMA
