
Bonk (BONK), the Solana-based meme coin, recently experienced a significant surge in its price, marking a notable increase in its value. Over the past month, it has seen a rise of 36%. However, on July 17, the coin declined 6.99%, dropping from $0.0000286 to $0.0000266. Currently, it is trading at $0.0000275, reflecting a 1.7% decrease, accompanied by a 39% decrease in trading volume over the last 24 hours.
According to analysis from Santiment’s data, there has been a notable decrease in Social Volume surrounding BONK, indicating reduced overall discussion and engagement. Additionally, Weighted Sentiment has also declined, highlighting a shift towards more negative sentiments prevailing over positive ones in recent discussions about the meme coin.

Despite these trends, BONK Futures Open Interest has increased by 4.34%, reaching $9.45 million in the last 24 hours. Furthermore, the its Long/Short Ratio Chart reveals a nearly balanced distribution between long and short positions, with longs accounting for 50.1% and shorts for 49.9%. This equilibrium suggests a state of market indecision, where neither buyers nor sellers currently dominate.
Analysts maintain a positive outlook on BONK’s future, anticipating potential price surges. Prominent analyst Alex Clay has revealed an optimistic outlook for the BONK/USDT trading pair, suggesting a bullish momentum due to an ascending triangle pattern. This pattern shows higher lows converging towards a horizontal resistance at 0.00002954 USDT. The token has repeatedly tested this resistance, indicating a potential breakthrough.

BONK Price Targets
Clay identifies three price targets if it breaks above its current resistance. The initial target is 0.00007430 USDT, marking early bullish confirmation. The second target, the Ascending Triangle Target, is 0.00011270 USDT, indicating sustained bullish sentiment. The most optimistic target is 0.00015150 USDT, driven by strong buying activity and market optimism.
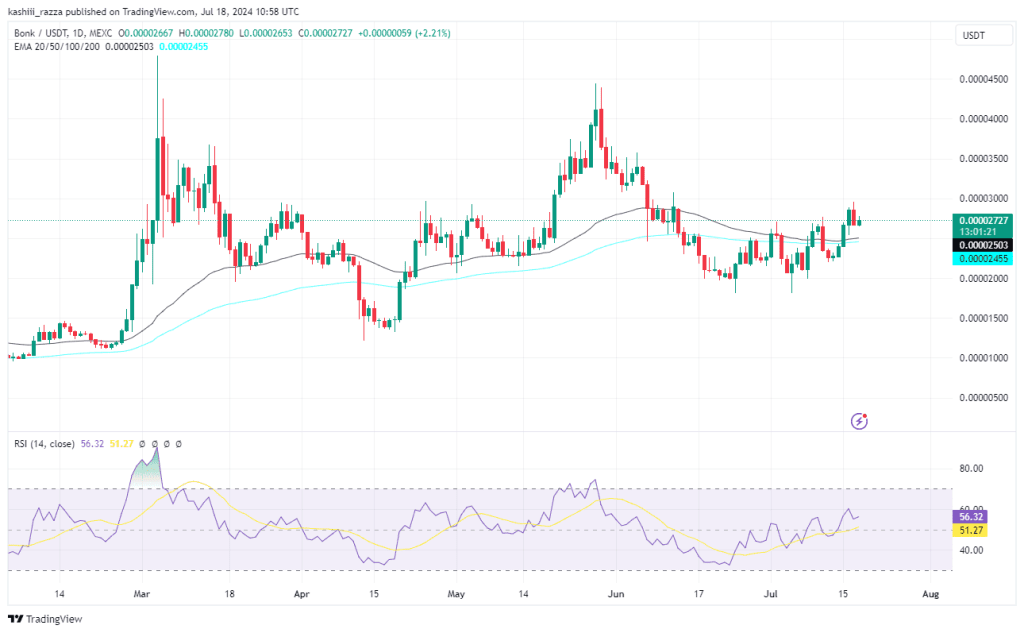
Technical indicators also support the bullish sentiment. BONK is trading above the 50-day and 100-day Exponential Moving Averages (EMAs), showing upward momentum. The Relative Strength Index (RSI) is at 56.32, indicating buying pressure exceeds selling pressure, with room for further upward movement without risking a significant pullback.
The Moving Average Convergence Divergence (MACD) confirms a bullish trend, with the MACD line above the signal line and positive histogram bars. The Chaikin Money Flow (CMF) is at 0.12, indicating capital inflow into BONK and reinforcing investor confidence.
As BONK nears the apex of its ascending triangle, market participants expect a breakout above the resistance level. A decisive move with robust trading volume could validate Clay’s projections and potentially propel it towards its forecasted targets.
Related Readings | Shiba Inu vs. Dogecoin: Win Big in Binance’s $100K Duel