
Bonk (BONK) is moving in a positive price trajectory following the changing conditions in the crypto market. However, the BONK price breakout is also supported by rising open interest. According to CoinMarketCap, the LINK is currently trading at $0.000007140, with the gain of 5.42% over the last 24 hours.

Source: CoinMarketCap
Derivative Data Point to Improving Strength
According to Coinglass, the BONK open interest increased by 3.32%, reaching $9.20 million, indicating fresh market participation and rising positions. This growth suggests traders are adding exposure, reflecting improving sentiment and potential continuation of momentum in the derivatives market.

Source: Coinglass
However, volume remained stable at $18.40 million, showing consistent trading activity and balanced market conditions. This stability reflects steady investor participation without major spikes, suggesting equilibrium between buying and selling pressure.
Also Read: BONK Could Surge to $0.00001050 After the Rounded Bottom Formation
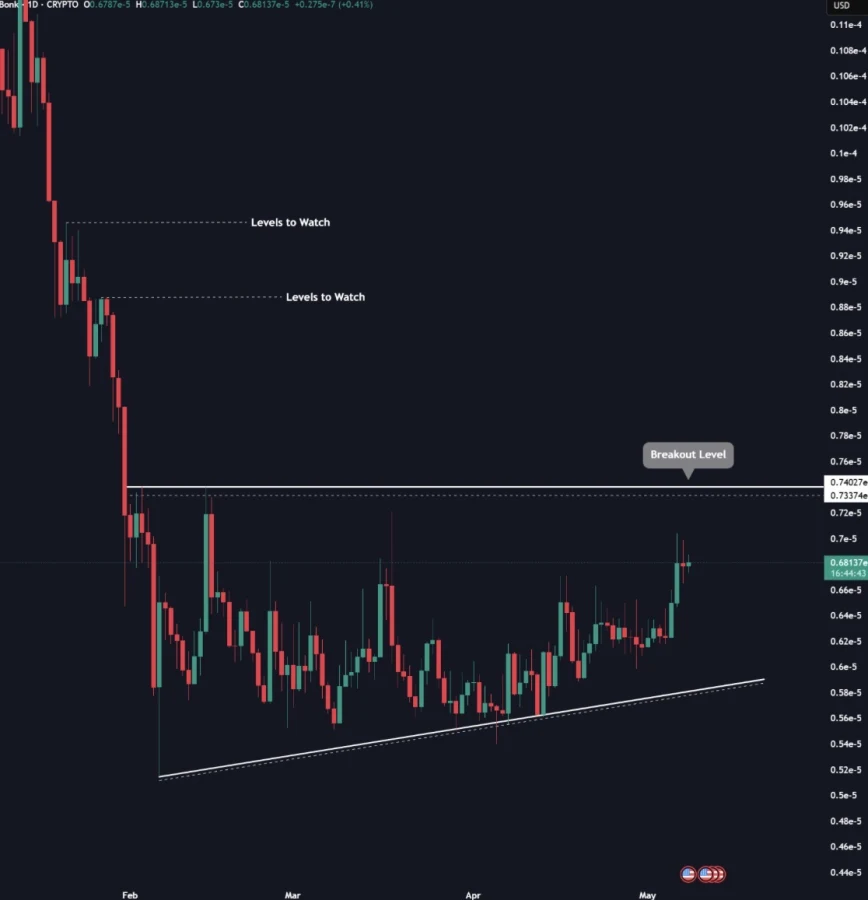
BONK Price Surge Signals a Rally Toward 0.94
Furthermore, the crypto analyst Chiefrat highlighted that the BONK price is showing renewed bullish momentum as the meme-inspired cryptocurrency continues forming higher lows, a technical pattern often linked with growing buyer confidence.
The BONK price is now approaching a major resistance zone between 0.733 and 0.740, where traders expect increased volatility. Market analysts believe sustained momentum could trigger BONK’s next significant upward breakout move soon.
Source: Chiefrat’s X Post
The breaking out of the resistance at 0.740 would set the stage for upward price moves towards higher supply regions, located at 0.88 and 0.94.
Traders have highlighted the need for a significant volume as an important factor that will confirm the breakout and drive the momentum behind it. In case the buyers remain dominant, the BONK price can post further gains.
Technical Indicators Point to a Bullish Reversal
According to TradingView, the BONK price has experienced a long period of stagnation from March to April, following a sharp fall during the month of February.
During this period, the BONK price trended sideways, indicating that the market was indecisive, with Bollinger Bands contracting and a decrease in volatility. It held on to its position close to the 20-day SMA.
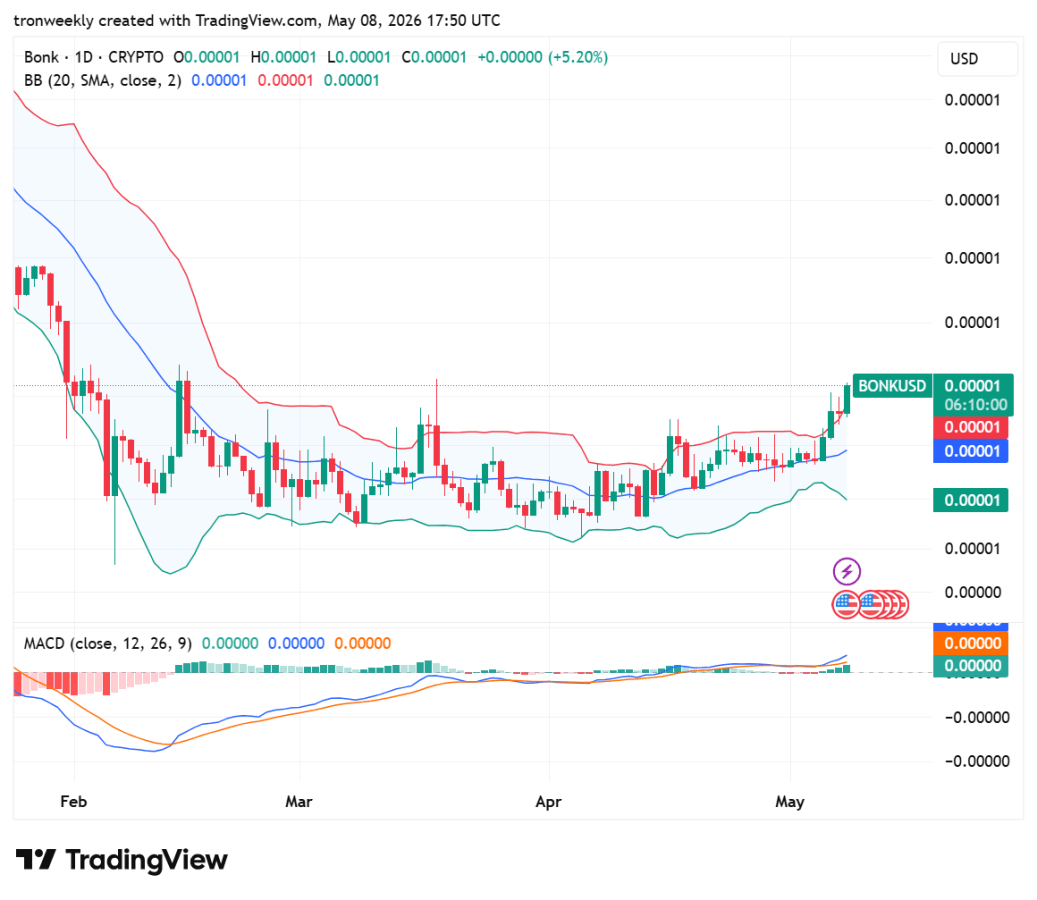
Source: TradingView
In May, an optimistic wave emerged with the appearance of the green candles, pushing the price higher towards the top Bollinger Band.
This trend is confirmed by the presence of a bullish MACD cross and rising green histogram bars, indicating increased buyer pressure. Currently, an increase of 5.20% in the BONK price suggests the likelihood of breaking out of the old horizontal channel.
This article contains market analysis and price predictions. These are not guarantees. Crypto markets are volatile. Always DYOR. Not financial advice.
Also Read: BONK Falling Wedge Breakout Could Trigger Rally Towards 0.0000260