• Skip to primary navigation
  • Skip to main content
  • Skip to primary sidebar
  • Skip to footer
  • About us
  • Write for us
  • Terms and Conditions
  • Privacy Policy
  • Disclaimer
  • Contact
  • All Posts
  • Advertise

TronWeekly

Crypto World News

  • Home
  • Education
    • Best TRON Wallets
    • Beginner’s guide to TRON
  • Opinion
    • Tron Tokens
    • Market Analysis
  • Industry
    • Tron Exchange
    • Project Review
  • Press Release
  • Advertise
  • About us
    • The Team
    • Editorial Policy
    • Write for us
    • Privacy Policy
    • Disclaimer
    • Terms and Conditions
    • Contact
You are here: Home / News / Cardano price crashes, market turns bearish; Good time to buy?
Cardano

Cardano price crashes, market turns bearish; Good time to buy?

November 26, 2021 by Parth Dubey

Cardano’s price turns bearish, unable to move past the resistance at $1.84. The nearest support zone rests at $1.6, but prices fell below this support zone. The support broke as a huge sell-off of Bitcoin brought it below $55,000.

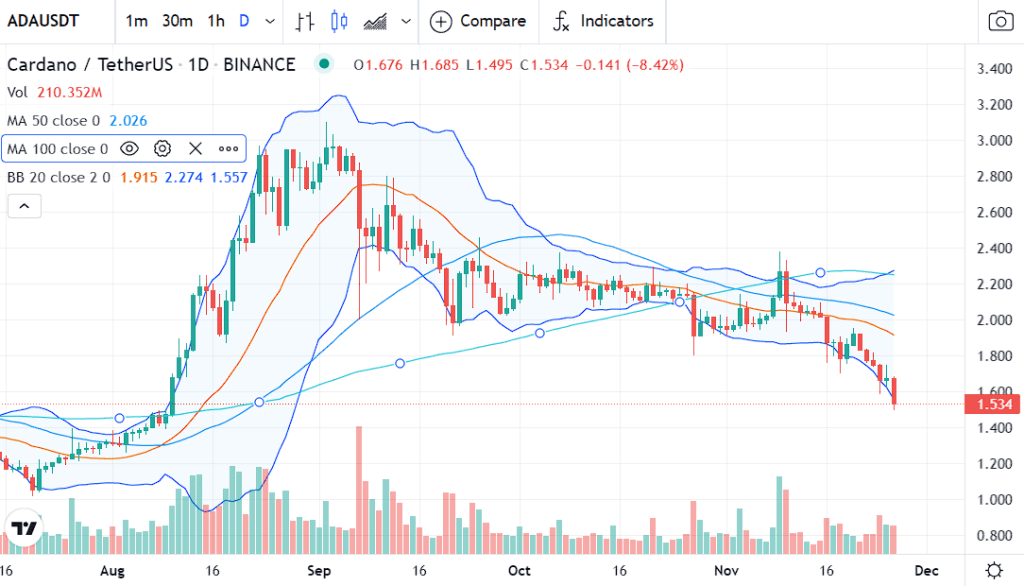
The daily candle opened at $1.676, reaching a daily high of $1.685. ADA reached a daily low of $1.495, dropping by more than 8.42% in a single day.

As per the data from CoinMarketCap, the trading volume of the token surged by 8.12%, resting at $3.3 billion. The ADA dominance of stands at 2.08%, with a market rank of 6.

The market cap of the token dropped by 8.29% and stood at $52 billion. The smart contracts platform has been bearish for the past 30 days, dropping by nearly 30%, as per data from CoinGecko.

Cardano price analysis using technical indicators

Cardano price analysis is bearish for today as the token broken out from the lower end of the Bollinger Bands, dropping to the $1.5 price level. Multiple daily bearish candles can be seen in the chart below.

The price action dropped below the 50-day and 100-day Moving Averages, breaking the chances of an uptrend formation. We might see bulls trying to conquer these key Averages in the near future.

Cardano price analysis
ADA price chart from TradingView

The MACD indicator remains bearish as the blue (MACD line) breaks below the price action, leading to a bearish histogram full of red bars. We might see lower prices today.

The RSI indicator enters the oversold region, and if this continues, Cardano might drop further. The gradient is negative, which represents a surge in selling pressure. Bears are in charge of the market movement and will give investors a run for their money.

image 33
Cardano price chart from TradingView

Conclusion

Cardano’s historical price movement suggests that it is indeed a promising investment and, right now, would be the best time to buy Cardano.

Filed Under: News, Altcoin News Tagged With: Cardano (ADA), cardano(ada) technical analysis

Primary Sidebar

Recent Posts

  • Is Cardano Being “Aggressively Priced” An Understatement? August 9, 2022
  • BitMex exec pleads guilty in violation of Anti-Money Laundering Act August 9, 2022
  • Robinhood Lists Stellar [XLM] And Avalanche [AVAX] Amidst SEC Probe August 9, 2022
  • Ethereum merge to leave Ether derivative trading unaffected: FTX August 9, 2022
  • Cardano’s Buying Activity Shoot Up Due To These Possible Reasons August 9, 2022

Footer

News

  • Altcoin News
  • Bitcoin News
  • Blockchain
  • Tron News
  • World

Digest

  • Meet the Founder
  • Price Winning Article
  • DeFi
  • Cyber Security
  • Crypto Scam

Industry

  • Project Review
  • Technology
  • Fintech
  • Tron Exchange
  • New in Town

Tron Universe

  • Event and Tron Parties
  • New in Town
  • Tron Tokens

Follow Us

Subscribe US

Copyright © 2022 · Tron Weekly. All Rights Reserved. NOTE: Tron Weekly is an independent crypto news site that adheres to the strict journalism policy anchored on transparency, trust, and objectivity, we have no affiliation with the TRON Foundation, its founder Justin Sun or any other cryptocurrency firm.