
- Chainlink price around $12.90 indicates possible jump towards $26 with breach of resistance.
- Key support is at $12.28, but upward momentum may be capped at $14.58.
- Resistance between $14.19-$14.58 holds 21.19 million Chainlink tokens, potentially capping LINK’s gains.
The cryptocurrency world is buzzing with Chainlink (LINK) indicating the bullish pressure. With LINK trading around the value of $12.90, analysts refer to the potential towards the price of $26 if it clears a key resistance zone. Overly oversold and the bearish reversal pattern has caught the attention of the market keenly.
According to Afritab post Chainlink’s price continues to hover around the $12.5 mark, showing minimal volatility in recent sessions. The market remains cautious as investors closely monitor on-chain metrics that could shape the token’s long-term direction.
Chainlink’s Critical Price Zones: $12.28 and $14.58
Crypto Analyst Ali Martinez figured critical levels shaping LINK’s direction. Support lies near $12.28, while $14.58 serves as a formidable resistance. The breach of the support line now creates a launchpad for potential bullish reversal. Breaking $14.58 could unlock a path toward higher highs in the short term.
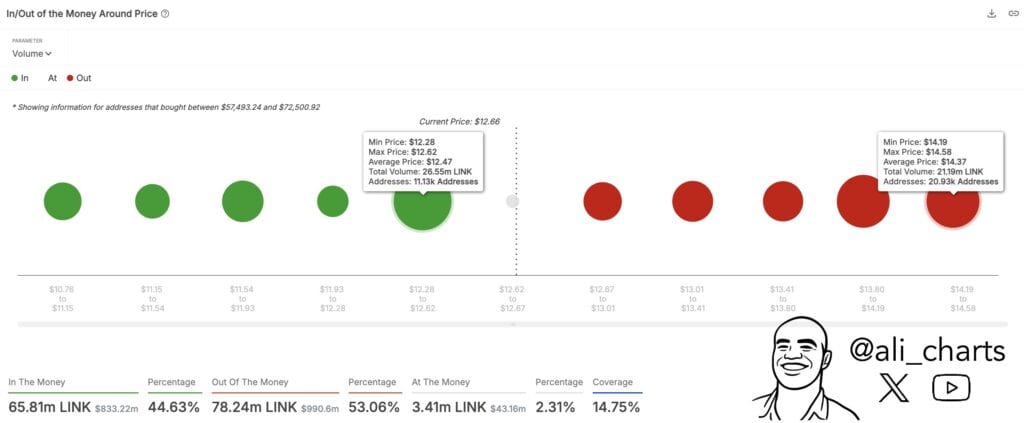
However, price rejection at that point is still possible based on sell pressure that occurred previously. Martinez’s strategy employs the use of cost-basis analysis to measure support and resistance levels. This approach looks at where most tokens were purchased, with such areas typically indicating how price will react afterward.
On-chain visualizations depict token concentration at price levels using dot sizes. Green dots under the price denote support, whereas red dots above denote resistance. Dots that are bigger indicate more substantial token volumes, which denote more assertive investor action along with greater areas of price impact.
LINK Faces Key $12.50 Support Level
IntoTheBlock data indicates that 11,130 addresses bought 26.55 million tokens between $12.28 and $12.62. This area is heavy support since investors will cover their entries, establishing strong support. These areas of accumulation tend to induce buying pressure, which cushions LINK from the pressure of selling.
Conversely, resistance looms near the $14.19–$14.58 region, where 20,930 wallets hold 21.19 million tokens. If LINK revisits this price range, sellers may emerge, aiming to break even. This action could cap gains and stall LINK’s bullish momentum unless volume and sentiment override the resistance wall.
A daily falling wedge above LINK’s lower high trendline suggests a breakout to $16 is realistic. Meanwhile, LINK’s intraday chart indicated indecisive price action, with movements restricted to a tight range. A breakout above $13.20 may offer a trading opportunity, whereas a drop below $11.80 would suggest a test of the key support level.
Read More: Chainlink (LINK) Set for Major Breakout: Will It Reach $26.50?