
- Chainlink flashes a bullish “buy” signal on the SuperTrend.
- Inverse head and shoulders pattern hints at a major price surge.
- M2 Money Supply growth fuels Chainlink’s potential rise to $70.
Chainlink (LINK) shows all indications for a bullish trend after its SuperTrend indicator flashed a buy signal at $14.99. LINK technical indicators now point to potential price appreciation despite its continuous downward trend after a drop from its $29 peak in February. If the current momentum holds, LINK could see further price appreciation.

Chainlink Inverse Head and Shoulders pattern
The LINK price shows an inverse head and shoulders pattern on the 6-hour chart which indicates a possible bullish price action. LINK recently surpassed its neckline resistance at $14.90 and moved toward the vital resistance zone between $16 and $16.50. LINK could see further price gains if it remains above its current resistance level.

Analysts predict that a decisive break above the $16.50 resistance barrier could initiate a 25% to 30% increase in price. The increased market interest in utility tokens such as Chainlink supports the positive market forecast for May. The investor sentiment predicts increased momentum if LINK maintains the current upward price trend.
Furthermore, Chainlink shows a major head and shoulders pattern on the weekly chart which indicates potential price growth. The pattern creates higher lows between $12 to $18 which indicates increased buying pressure and market compression. If LINK breaks out of the resistance zone, the cryptocurrency could see explosive growth towards $60.
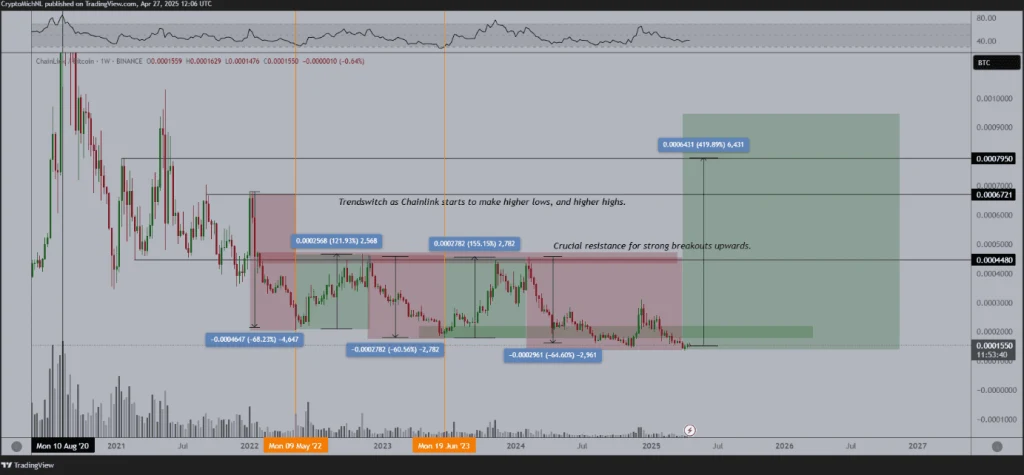
ChainLink Vs Bitcoin
The crucial support on Chainlink versus Bitcoin chart further validates the bullish market outlook. Analyst Michaël van de Poppe predicts that the current retest could trigger substantial upward price movement based on historical data. Poppe predicts a potential Chainlink’s price breakout against Bitcoin could trigger a major price growth.
Technical Analysis
The macroeconomic market trends such as the increase in M2 Money Supply indicator further supports Chainlink’s bullish outlook. The correlation between LINK’s price and increased money supply demonstrates further sustained price growth. Technical indicators such as the 50-day and 200-day Exponential Moving Averages (EMAs) supports a further surge in LINK Price.
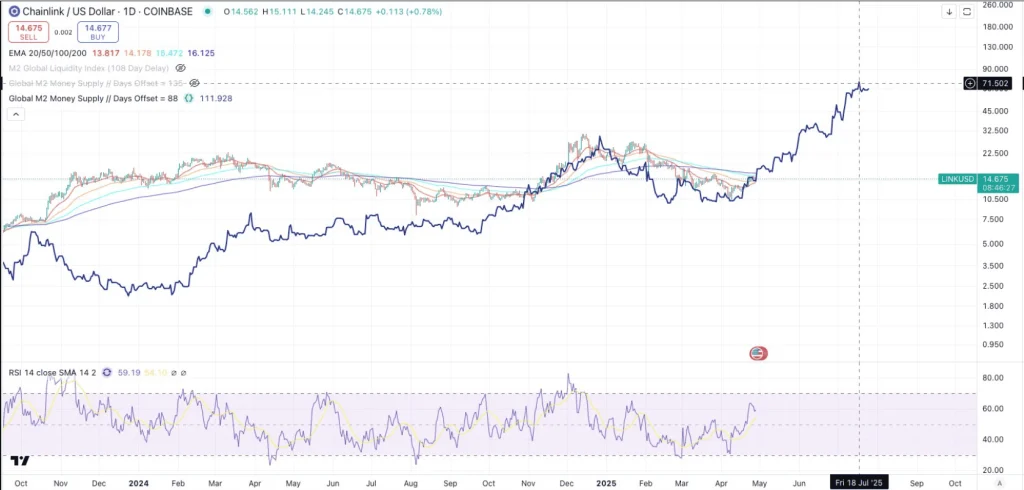
The current Relative Strength Index (RSI) points to further upward price movement. These indicators forecast that LINK could rise to $70 by July 2025. Investors continue to monitor the macroeconomic and liquidity factors which could lead to continued price growth.
LINK’s recently surpassed the $15.30 resistance level which strengthens its short-term bullish outlook. This increases LINK potential to breach critical resistance level at $16 and rise to $19.50. LINK price continues to create higher support levels which solidifies its robust bullish outlook.