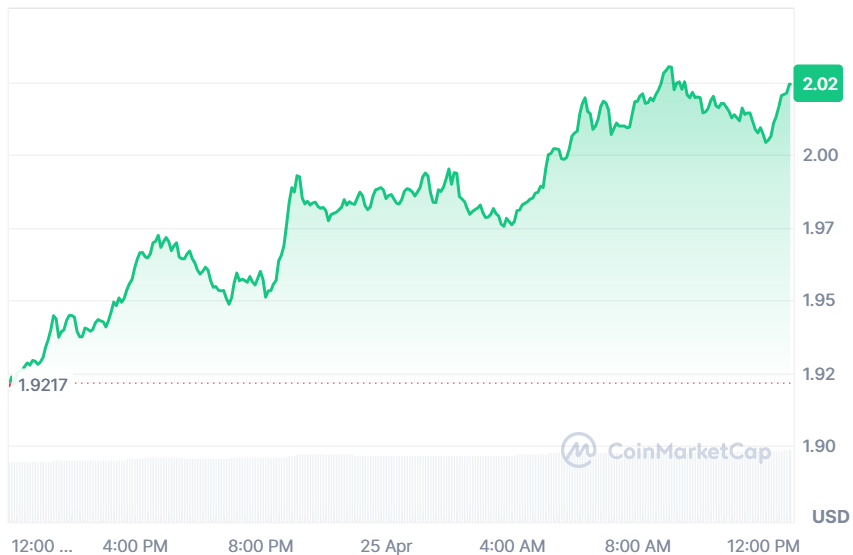
Cosmos (ATOM) is moving in a positive price trajectory with a strong reversal ahead as the token has bounced from the descending channel’s support level. According to CoinMarketCap, the ATOM price has surged by 5.06% over the last 24 hours and 9.72% over the last week.
At the time of writing, ATOM is trading at $2.02, with a trading volume of $63.09 million, which has surged by 19.04% over the last 24 hours. However, its market capitalization stands at $1.02 billion, which is also up by 5.1%.
Source: CoinMarketCap
Also Read: Cosmos (ATOM) Eyes Major Rebound: Could $14.50 Be the Next Stop?
ATOM Price Rebound Signals Rally Toward $10
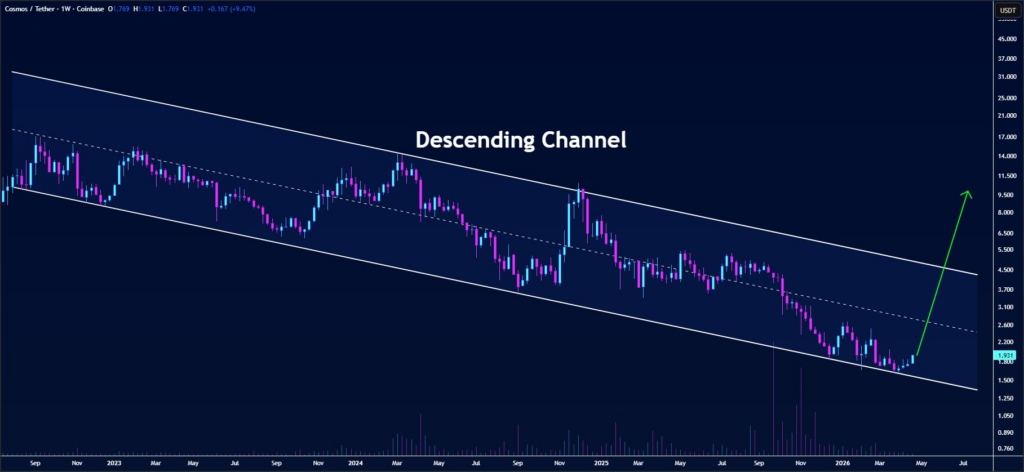
Furthermore, the crypto analyst Butterfly highlighted that ATOM is showing early signs of a potential bullish shift after rebounding from the lower boundary of a descending channel on the weekly chart.
This key support level has held firmly, signaling weakening selling pressure. Buyers are gradually stepping in, suggesting accumulation and a possible change in market sentiment after an extended period of downside movement.
Source: Butterfly’s X Post
Such a pattern is catching the eye as the force is shifting in favor of the bulls. In case this trend holds true, ATOM is likely to rally towards higher resistance zones, $10 being one of those targets. In case of breakouts from the current channel, the optimistic scenario will gain more strength.
Momentum Indicators Reinforce Ongoing Reversal
According to TradingView, the RSI indicates a positive momentum as it goes up to 61.57. Moving up past 50 implies the increase in buying power, where the bulls are in control.
As such, an uptrend in both RSI and its moving average indicates that there has been a move from a consolidated market sentiment to a bullish sentiment.
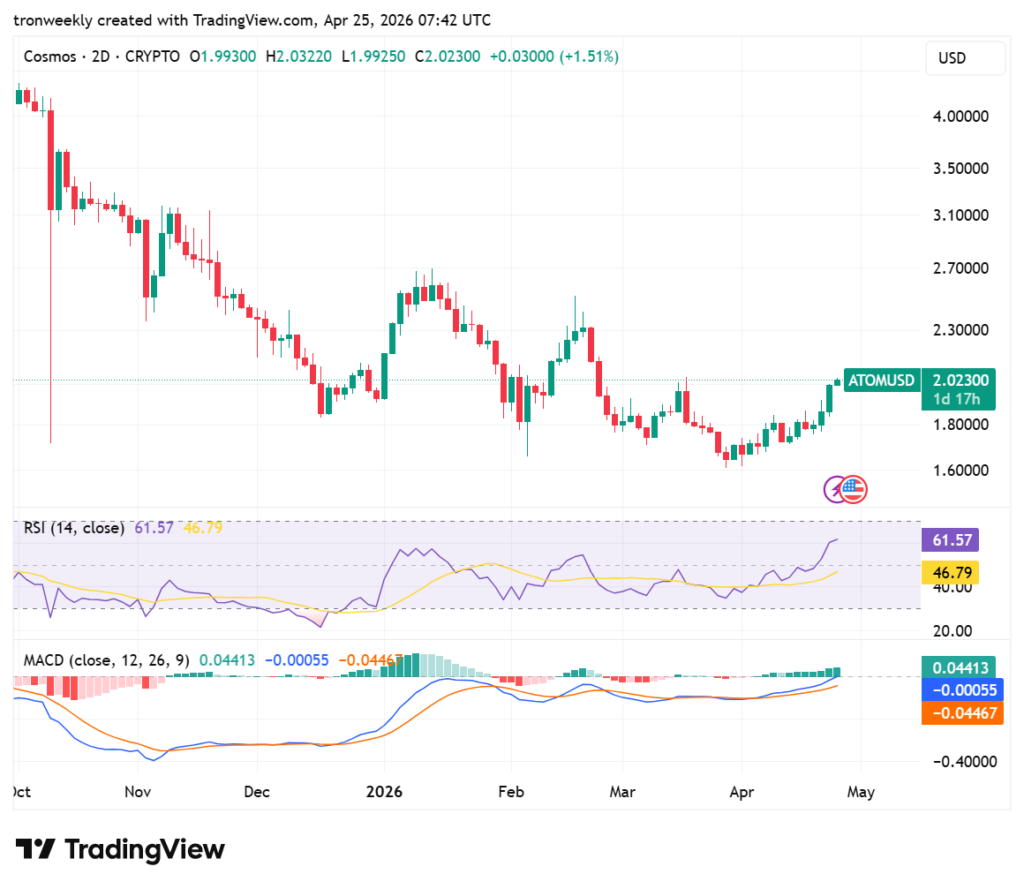
Source: TradingView
Furthermore, there is an indication of the same trend in the MACD indicator, which shows that the MACD line crosses above the signal line.
The histogram, on its part, is showing a positive green column, suggesting increasing upward pressure. This clearly indicates that the ongoing recovery in prices is backed by strong conviction in the market.
This article contains market analysis and price predictions. These are not guarantees. Crypto markets are volatile. Always DYOR. Not financial advice.
Also Read: Cosmos (ATOM) at Critical $1.735 Level: Rejection or Breakout Toward $10.50 Ahead