
DASH is gaining renewed market attention as its long-term chart structure shows signs of recovery after an extended period of decline. DASH price is stabilizing within a broader accumulation phase, with analysts watching for a breakout above key resistance zones that could support further upward momentum. According to CoinMarketCap, as of Saturday, May 9, DASH is trading at $50.16 with a 24-hour gain of 1.9%.
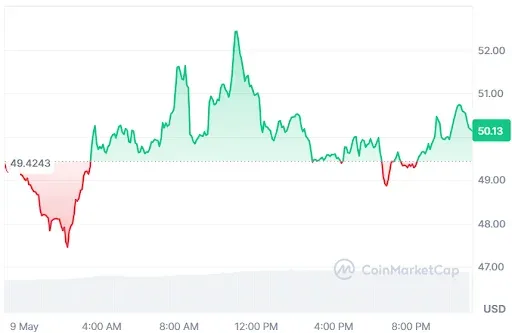
Source: CoinMarketCap
Also Read: Dash (DASH) Bullish Breakout Signals Targets $55 Resistance After 28% Rally
DASH Price Could Surge to $476 If Momentum Holds
Furthermore, the crypto analyst Flippix revealed that DASH is beginning to attract attention as its long-term chart structure starts resembling previous deep-value recovery plays seen across older crypto cycles.
After years of decline, the asset has stopped printing major new lows and is now stabilizing within a broad accumulation range, signaling that prolonged selling pressure may finally be fading from the market.
Analysts are looking at the older resistance levels that had played important roles during the last bullish wave, namely at $137, $286, and $476.
The DASH price continues trading well below the levels where it used to set highs, and in the environment of low volatility, any small positive move can translate into significant increases.
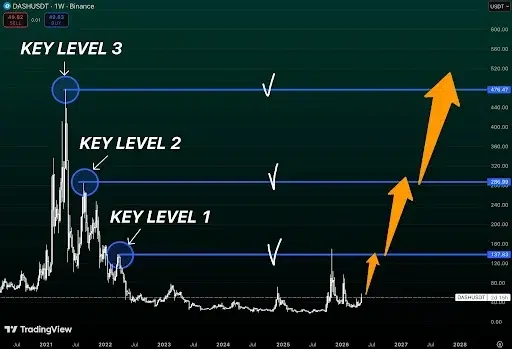
Source: Flippix’s X Post
Technical confirmation of such a move would include a strong bounce back into the region of $130 to $140, which previously provided strong resistance for price growth.
If the DASH price holds above that region amid an overall crypto uptrend, the chart will very quickly open up towards new weekly resistance levels.
Technical Indicators Support Upward Momentum
According to TradingView, the DASH price on the daily chart shows a significant bullish breakout following a period of consolidation in the range of $30. The DASH price recently went above the 200-day moving average, which currently stands at $46.87.
The current price is $50.12; however, this is after several instances of rejection seen from the formation of upper long shadows.
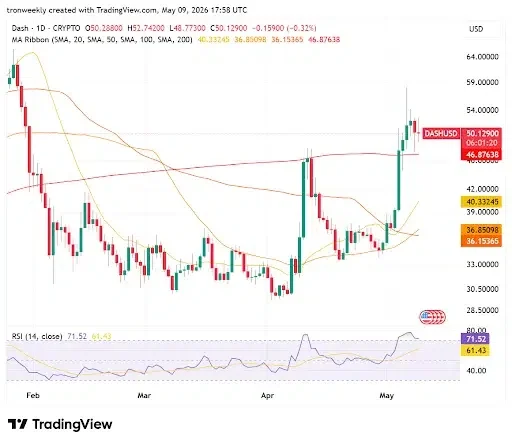
Source: TradingView
Technical analysis suggests that the move has gone on for too long. The RSI value is now 71.52, indicating that it is in overbought territory, which generally sets the stage for a reversal of direction, or at least a sideways move in the short term.
While the moving average ribbon does form a bullish fan pattern, it is likely that the price will retest the $47 level.
This article contains market analysis and price predictions. These are not guarantees. Crypto markets are volatile. Always DYOR. Not financial advice.
Also Read: DASH Falling Wedge Signals Potential Bullish Breakout Move Toward $250