
Dogecoin is building a key support zone with heavy past trading activity suggesting potential buyer interest. Technical indicators still show bearish momentum and increasing selling pressure after a recent decline in the DOGE price. Derivatives data also points to weaker sentiment with reduced trading activity and caution in the market.
At the time of writing, DOGE is trading at $0.08356 with a 24-hour trading volume of $593.19 million and a market capitalization of $14.21 billion. Despite the 2.01% loss over the last 24 hours, the DOGE price structure points to a bullish reversal ahead.

Source: CoinMarketCap
Dogecoin Price Structure Strengthens Around $0.081
Furthermore, the crypto analyst Ali Charts highlighted that Dogecoin saw over 30 billion tokens last transacted around the $0.081 price level, forming one of the most significant cost-basis clusters in recent market activity.
This heavy concentration of historical transactions highlights a key zone where a large portion of supply last changed hands, creating a strong reference point for on-chain analysts tracking market structure.

Source: Ali Charts’ X Post
This dense bunching around the 0.081 level is viewed as an important support level for the DOGE because most of the holders are at break-even points, so they might rally around the DOGE if it falls to this level.
This is a psychological and technical support level, which traders will observe to determine the DOGE price breakout if there is any buyer sentiment developing.
Also Read: Dogecoin Consolidation Fits 5-Phase Wyckoff Model
MACD Red Candles Point to Bearish Dominance
According to TradingView, the DOGE seems to have made a very significant change in terms of its direction. Following an even tempo in April, Dogecoin took off in May, reaching up to $0.117 before plummeting sharply in June due to selling pressure.
DOGE declined below its 20-period simple moving average ($0.09440), crossing under the lower Bollinger Band and settling at $0.08368.
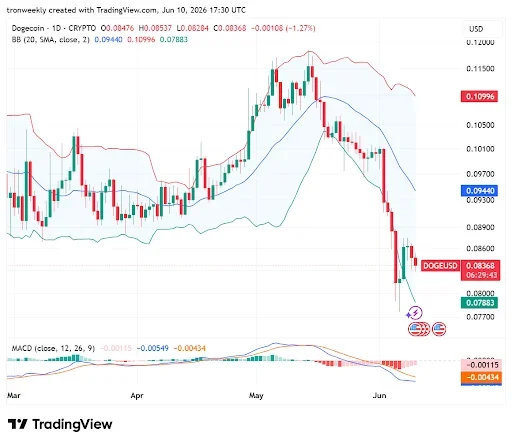
Source: TradingView
Technical analysis provides more information to confirm that we are dealing with a very significant bear attack. First, Bollinger Bands expanded rapidly, indicating a sudden spike in volatility in the markets as sellers entered.
In addition, the MACD line crossed below its signal line and entered the negative zone, while bars on the histogram grew in size.
DOGE Derivative Data Point to Downward Pressure
However, open interest for DOGE declined by 3.12% to $1.00 billion. This reflects that there is some decrease in the number of active trade positions taken by traders, which represents cautious sentiment.
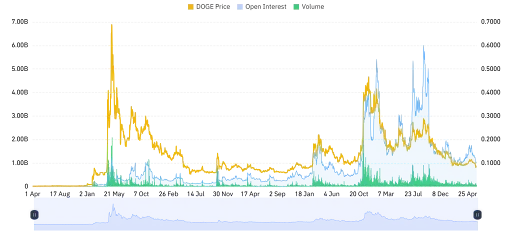
Source: Coinglass
The trading activity fell to 7.97% and closed at $1.35 billion. This decline indicates that there is lower market activity compared to previous trends, which implies that the demand for the token would be low in the coming period.
This article contains market analysis and price predictions. These are not guarantees. Crypto markets are volatile. Always DYOR. Not financial advice.
Also Read: Dogecoin Price Weakens Sharply as Market Eyes Recovery Toward $0.1019 and $0.1156